Can Solana rally past $87 after strong on-chain and futures signals?

0
0
The cryptocurrency market is taking a breather following its rally earlier this week. Bitcoin briefly hit the $79,000 level on Wednesday but has slightly retraced and is now trading at $77,870.
Ethereum has also dropped below $2,400, while XRP failed to maintain its rally above $1.50.
Solana’s SOL is not left out as it is down by 1.3% in the last 24 hours.
The coin failed to take out the technical resistance at $87 on Wednesday and is now trading at $85 at press time.
However, a breakout above the $87 technical hurdle would signal a bullish move ahead.
Strengthening on-chain, improving derivatives data, and a constructive technical chart support a positive outlook for SOL in the near term.
SOL’s on-chain and derivative data paint a bullish picture
SOL is down by more than 1% in the last 24 hours, but could rally higher in the near term amid bullish sentiment.
CryptoQuant summary data suggests a bullish outlook for Solana.
On-chain data shows that SOL’s spot markets are recording the presence of large whale orders and cooling conditions.
The futures markets are also showing buy-side dominance, suggesting a potential upside move.
On the derivatives side, the funding rates also support a positive case.
SOL’s funding rates flipped positive on Monday and rose to 0.0016% on Thursday, indicating that the longs are paying the shorts.
Usually, when rates have turned positive and risen, the Solana price has surged sharply.
The futures Open Interest (OI) also reads $5.15 billion, indicating growing retail interest in Solana.
Solana price forecast
The SOL/USD 4-hour chart is bullish and efficient thanks to the rally in recent days. Solana is currently trading below $86 after three consecutive days of gains so far this week.
However, its price action remains limited as Solana is trading below the 50-day, 100-day, and 200-day Exponential Moving Averages (EMAs)
Buyers would encounter immediate pressure from nearby resistance at the 23.6% Fibonacci retracement of the latest swing at $86.67 and the 50-day EMA at $87.08, which the pair has failed to reclaim so far.
The momentum indicators suggest that the buyers remain in control. The Relative Strength Index (RSI) on the 4-hour chart hovers just above the 50 line.
Meanwhile, the Moving Average Convergence Divergence (MACD) remains marginally positive, hinting at modest bullish attempts that so far struggle against the prevailing overhead supply.
If the rally persists, initial resistance is seen at the $86.67 Fibonacci 23.6% level, followed by the 50-day EMA at $87.08.
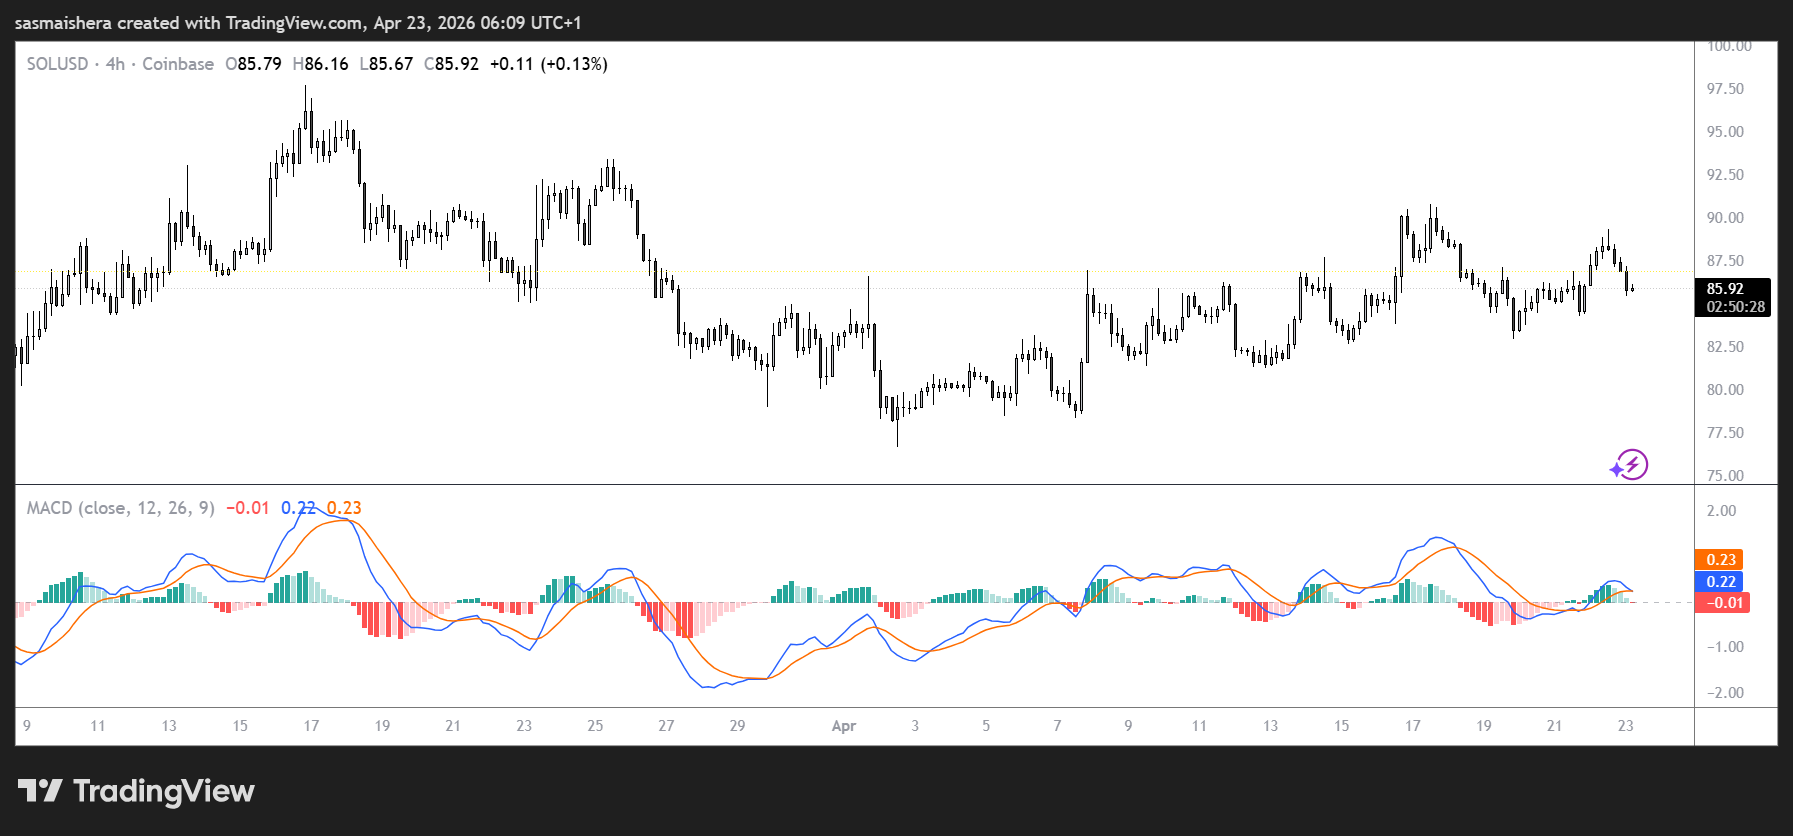
A daily candle close above this level would expose the channel top around $92.11 and then the 100-day EMA at $96.65, ahead of the denser retracement barrier near the 38.2% Fibonacci level at $98.53.
However, if the bears regain control, they would encounter immediate support at the $77.12 region.
A decisive breakdown below this level would pave the way for the major Fibonacci anchor near $67.50.
The post Can Solana rally past $87 after strong on-chain and futures signals? appeared first on Invezz
0
0


 Manage all your crypto, NFT and DeFi from one place
Securely connect the portfolio you’re using to start.

0
0

0
0

0
0
