Decoding Growth: Bitcoin ETF Monthly Review and Analysis
14d ago•

bullish:
0
bearish:
0
Share

The post Decoding Growth: Bitcoin ETF Monthly Review and Analysis appeared first on Coinpedia Fintech News
Enter the realm of Bitcoin ETFs, a burgeoning trend that recently gained significant momentum.
The monthly analysis, which delves deep into the performance of both Bitcoin Futures ETS and Spot ETFs, aims to provide invaluable insights for all, including newcomers. This dissects key metrics including one-month average volume, expense ratio, one-month return, and net fund flow. But that is not all – this exploration goes beyond the numbers, offering an in-depth technical analysis to unveil hidden insights.
Get ready to gain a deeper understanding of the ETF landscape.
1. Bitcoin Futures ETF In-Depth Analysis
At the time of performing this analysis, BITO, BTF, BITS, ARKA, DEFI, BETH, BETE, ARKY, ARKC, and BITC are the prominent players in the Bitcoin Futures ETF market.
| Bitcoin Futures ETF | AUM |
| BITO | $2,381.3M |
| BTF | $50.3M |
| BITS | $23.5M |
| ARKA | $16.8M |
| DEFI | $11.6M |
| BETH | $6.9M |
| BETE | $5.1M |
| ARKY | $4.5M |
| ARKC | $2.4M |
| BITC | $1.3M |
Among them, BITO, BTF, BITS, ARKA, DEFI, BETH, and BETE are the top seven Bitcoin Futures ETFs, on the basis of Asset Under Management.
Let’s analyse these top Bitcoin Futures ETFs deeply using various parameters.
1.1. Bitcoin Futures ETF: A Basic Data Overview
This basic data overview gives an overall picture of the top player’s performance.
| Bitcoin Futures ETF | Price | Price Change | Volume | 1 Month Average Volume | 3 Month Average Volume | AUM | Shares |
| BITO | $29.03 | N/A | 9,818,100 | 15,493,391 | 20,171,544 | $2,381.3M | 85.7M |
| BTF | $19.20 | +2.78% | 46,900 | 47,687 | 70,756 | $50.3M | 2.7M |
| BITS | $65.51 | +5.22% | 10,300 | 9,443 | 11,563 | $23.5M | 0.4M |
| ARKA | $63.88 | +3.51% | 1,900 | 4,622 | 6,603 | $16.8M | 0.3M |
| DEFI | $76.25 | +3.64% | 2,100 | 13,722 | 9,353 | $11.6M | 0.2M |
| BETH | $80.51 | +3.25% | 2,100 | 2,004 | 2,128 | $6.9M | 0.1M |
| BETE | $76.68 | +3.02% | 6,500 | 2,152 | 2,584 | $5.1M | 0.1M |
Let’s go beyond what the basic data communicates.
1.2. Bitcoin Futures ETF Monthly Average Volume Analysis
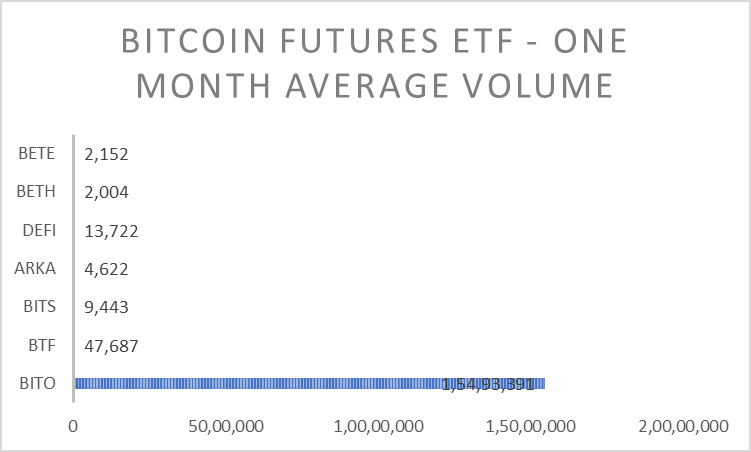
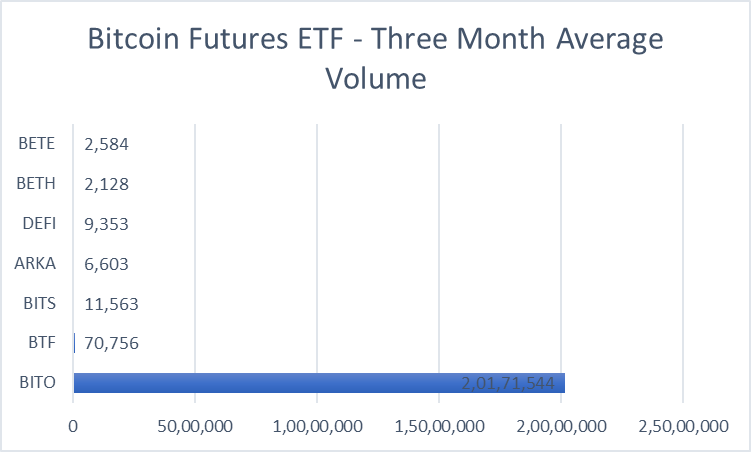
| Bitcoin Futures ETF | 1 Month Average Volume | 3 Month Average Volume |
| BITO | 15,493,391 | 20,171,544 |
| BTF | 47,687 | 70,756 |
| BITS | 9,443 | 11,563 |
| ARKA | 4,622 | 6,603 |
| DEFI | 13,722 | 9,353 |
| BETH | 2,004 | 2,128 |
| BETE | 2,152 | 2,584 |

As per the analysis made using the one month average volume indicator, among the top seven Bitcoin Futures ETFs, BITO dominates, marking an one-month average volume of 15,493,391, which is lower than its three-month average volume of 20,171,544. BTF follows with 47,687 – this value is also far lesser than its three-month average volume of 70,756. DEFI, which marks an one-month average volume of 13,722, outperforms its three-month average volume of 9,353.
1.3. Bitcoin Futures ETF Expense Ratio Analysis
The below data compares the cost efficiency of a Bitcoin Futures ETF to its peers.
| Bitcoin Futures ETF | Expense Ratio (in %) |
| BITO | 0.95% |
| BTF | 1.24% |
| BITS | 0.65% |
| ARKA | 0.70% |
| DEFI | 0.94% |
| BETH | 1.33% |
| BETE | 1.33% |
Among the top Bitcoin Futures ETFS, BETE and BETH, both, have the highest expense ratio of 1.33%. BTF closely follows with 1.24%.. BITO registers 0.95% expense ratio, and DEFI marks 0.94%. BITS shows the lowest ratio of 0.65%. ARKA, with 0.70%, is the second lowest.
1.4. Bitcoin Futures ETF Performance Analysis
This data shows how a Bitcoin Futures ETF has performed relative to its peers this month.

| Bitcoin Futures ETF | 1 Month Return (in %) | 3 Month Return (in %) |
| BITO | -4.87% | 54.15% |
| BTF | -8.35% | 38.25% |
| BITS | -7.01% | 40.99% |
| ARKA | -5.03% | 53.03% |
| DEFI | -4.69% | 50.82% |
| BETH | -6.46% | 45.08% |
| BETE | -8.10% | 37.42% |
Among the top seven Bitcoin Futures ETFs, as per the analysis done using the one-month return indicator, all the top ETFs show negative returns. BTF, with the negative return of -8.35%, is the worst performer. BETE follows with -8.10%. BITS registers -7.01% return. BETH and ARKA showcase -6.46% and -5.03%, respectively. With -4.69%, DEFI demonstrates a better performance. BITO follows with -4.87%.
Notably, in the three-month return analysis also, BITO, with 54.15%, displays far better performance than others. ARKA, with 53.03%, and DEFI, with 50.82%, follow closely.
1.5. Bitcoin Futures ETF One Month Net Fund Flow Analysis
| Bitcoin Futures ETF | One Month Net Fund Flow |
| BITO | -256.68M |
| BTF | -1.14M |
| BITS | -2.22M |
| ARKA | +0.01015M |
| DEFI | -14.59M |
| BETH | 0 |
| BETE | 0 |
Among the top seven Bitcoin Futures ETFs, only ARKA exhibits positive net fund flow. ARKA marks a one-month net fund flow of +0.01015 million. BITO showcases the biggest negative fund flow of -256.68 million. DEFI shows -14.59 million, and BITS and BTF show -2.22M and -1.14M, respectively.
1.6. Bitcoin Futures ETF Technical Analysis
| Bitcoin Futures ETF | Williams % Range (20 Days) | MACD (15 Period) | 20 Day Moving Average | RSI (30 Days) | 20 Day Volatility | Current Price |
| BITO | 64.02 | -1.11 | $29.48 | 53 | 65.92% | $29.03 |
| BTF | 71.47 | -0.97 | $19.92 | 51 | 67.50% | $19.20 |
| BITS | 72.63 | -2.51 | $66.57 | 50 | 61.21% | $65.51 |
| ARKA | 65.34 | -2.45 | $64.77 | 53 | 65.01% | $63.88 |
| DEFI | 71.07 | -2.87 | $77.05 | 53 | 64.47% | $76.25 |
| BETH | 68.77 | -3.62 | $82.49 | 52 | 63.65% | $80.51 |
| BETE | 72.35 | -3.87 | $79.32 | 51 | 66.09% | $76.68 |
To do the technical analysis of these seven Bitcoin Future ETFs, we use five prime technical indicators: Williams % Range (20 Days), MACD (15 Period), 20-Day Moving Average, RSI (30 Days) and 20-Day Volatility.
The Williams % Range (20 Days) indicates that BTF, BITS, DEFI, and BETE are moving towards the overbought territory. This means that a price correction or reversal could be on the horizon. BITO, ARKA and BETH are neither in the overbought, nor in the oversold territory.
As per the MACD (15 Period) indicator, all the ETFs show bearish trends, because none of them show positive value. When the MACD is in the negative range, it indicates that the shorter-term moving average is below the longer-term moving average.
The 20-Day Moving Average suggests that only ARKA is in the bullish phase, as the current value of none of the others outperform its average value.
The RSI (30-Days) indicators convey that all the ETFs remain in the bullish territory, as the RSI value of every ETF is either 50 or above 50.
As per the 20-Day volatility analysis, BITS and BETH enjoy comparatively lower level price fluctuations. BTF and BETE have higher level price fluctuations, and so have potential for sharp price movements.
Also Check Out : Stablecoin Performance and Analysis Update: An In-depth Monthly Report
2. Bitcoin Spot ETF In-Depth Analysis
At the time of doing this analysis, GBTC, IBIT, FBTC, ARKB, BITB, HODL, BRRR, BTCO, EZBC, and BTCW are the prominent players in the Bitcoin Spot ETF market.
| Bitcoin Spot ETF | AUM |
| GBTC | $19,381.0M |
| IBIT | $17,303.5M |
| FBTC | $9,659.2M |
| ARKB | $2,774.1M |
| BITB | $2,162.7M |
| HODL | $590.7M |
| BRRR | $502.2M |
| BTCO | $390.3M |
| EZBC | $312.4M |
| BTCW | $78.8M |
Among them, GBTC, IBIT, FBTC, ARKB, BITB, HODL and BRRR are the top seven Bitcoin Spot ETFs based on Asset Under Management.
Let’s analyse these top Bitcoin Spot ETFs using various parameters.
2.1. Bitcoin Spot ETF: A Basic Data Overview
This basic data overview offers an overall picture of the top player’s performance.
| Bitcoin Spot ETF | Price | Price Change | Volume | 1 Month Average Volume | 3 Month Average Volume | Shares | AUM |
| GBTC | $59.26 | +3.40% | 7,510,600 | 12,233,719 | 16,223,058 | 342.4M | $19,381.0M |
| IBIT | $37.93 | +3.44% | 29,881,102 | 40,252,704 | 39,155,628 | 479.6M | $17,303.5M |
| FBTC | $58.23 | +3.39% | 6,580,300 | 9,599,762 | 11,634,737 | 174.4M | $9,659.2M |
| ARKB | $66.60 | +3.38% | 1,606,900 | 2,359,619 | 2,981,728 | 43.2M | $2,774.1M |
| BITB | $36.33 | +3.47% | 1,568,400 | 2,360,881 | 2,977,542 | 61.7M | $2,162.7M |
| HODL | $75.38 | +3.59% | 225,500 | 313,848 | 489,970 | 8.1M | $590.7M |
| BRRR | $18.80 | -0.37% | 187 | 714,648 | 552,800 | 28.0M | $502.2M |
Let’s go beyond what the basic data conveys.
2.2. Bitcoin Spot ETF Average Volume Analysis
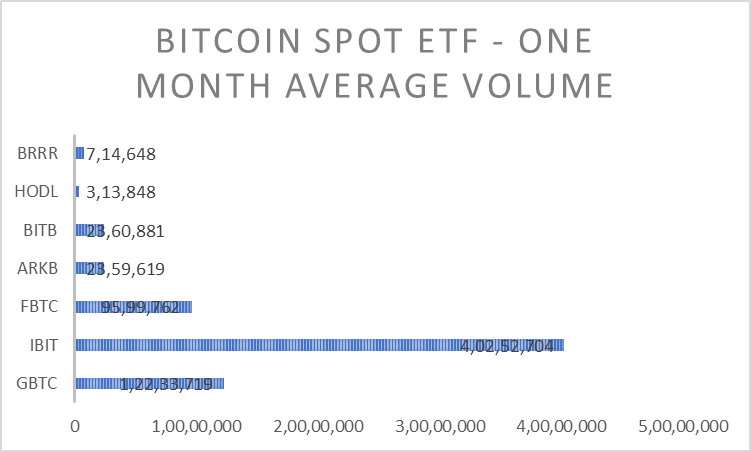
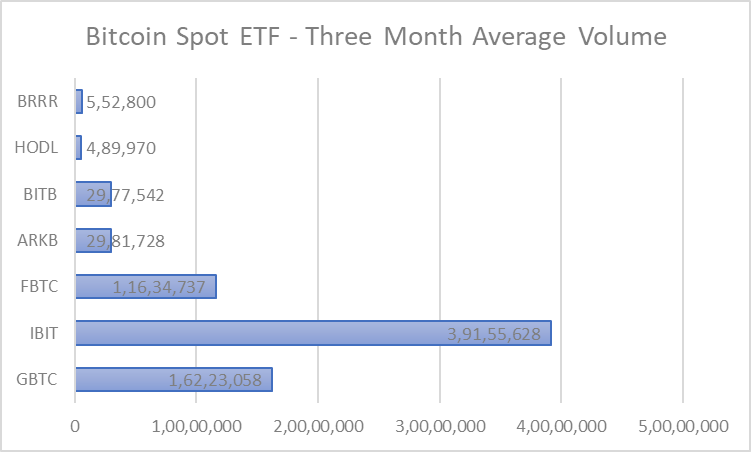
| Bitcoin Spot ETF | 1 Month Average Volume | 3 Month Average Volume |
| GBTC | 12,233,719 | 16,223,058 |
| IBIT | 40,252,704 | 39,155,628 |
| FBTC | 9,599,762 | 11,634,737 |
| ARKB | 2,359,619 | 2,981,728 |
| BITB | 2,360,881 | 2,977,542 |
| HODL | 313,848 | 489,970 |
| BRRR | 714,648 | 552,800 |

Among the top seven Bitcoin Spot ETFs, IBIT has the highest one-month average volume of 40,252,704. GBTC and FBTC follow with 12,233,719 and 9,599,762, respectively. IBIT’s one month volume is higher than its three-month volume of 39,155,628. Conversely, GBTC’s one month volume is far lesser than its three-month volume of 16,223,058. FBTC’s one-month volume also experiences a similar slip in volume, from 11,634,737 to 9,599,762.
2.3. Bitcoin Spot ETF Expense Ratio Analysis
The below data compares the cost efficiency of a Bitcoin Spot ETF to its peers.
| Bitcoin Spot ETF | Expense Ratio (in %) |
| GBTC | 1.50% |
| IBIT | 0.12% |
| FBTC | N/A |
| ARKB | 0.21% |
| BITB | 0.20% |
| HODL | 0.25% |
| BRRR | 0.25% |
Among the top seven Bitcoin Spot ETFs, GBTC has the top expense ratio of 1.50%. HODL and BRRR, both, report 0.25% expense ratio. IBIT, with the expense ratio of 0.12%, is the one with the lowest. There are reports that in order to gain a better competitive edge, Grayscale is planning to introduce a new ETF, with competitive expense ratio, named Grayscale Bitcoin Mini Trust.
2.4. Bitcoin Spot ETF Performance Analysis
This data shows how a Bitcoin Spot ETF has performed relative to its peers this month.

| Bitcoin Spot ETF | One Month Return | Three Month Return |
| GBTC | 1.98% | 60.12% |
| IBIT | 2.10% | 59.37% |
| FBTC | 2.07% | 59.58% |
| ARKB | 2.12% | 59.60% |
| BITB | 2.19% | 59.83% |
| HODL | 2.07% | 59.67% |
| BRRR | 1.94% | 59.64% |
Among the top seven Bitcoin Spot ETFs, BITB marks the highest one month return of 2.19%. ARKB and IBIT follow with 2.12% and 2.10%, respectively. FBTC and HODL, both, display 2.07% return.
As per the three-month return analysis, GBTC shows the highest return of 60.12%. All the others register more than 59% return.
2.5. Bitcoin Spot ETF Net Fund Flow Analysis
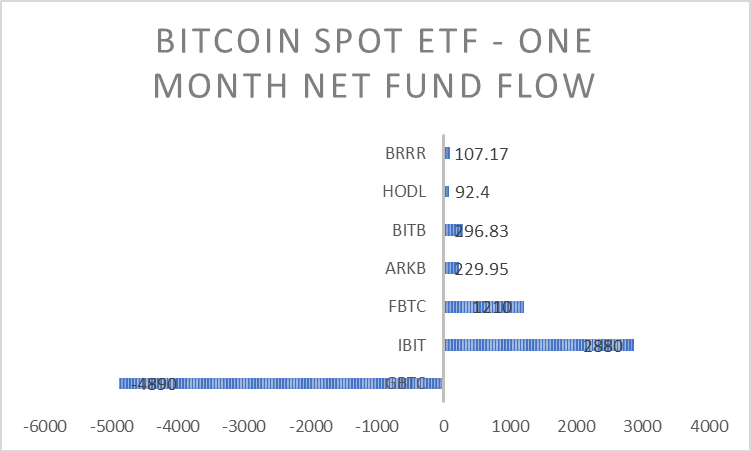
| Bitcoin Spot ETF | 1 Month Net Fund Flow |
| GBTC | -4890M |
| IBIT | +2880M |
| FBTC | +1210M |
| ARKB | +229.95M |
| BITB | +296.83M |
| HODL | +92.4M |
| BRRR | +107.17M |
Among the top seven Bitcoin Spot ETFs, IBIT exhibits the highest positive net fund flow of +2880M. FBTC follows with +1210M. ARKB, BITB, BRRR and HODL display positive fund flow. Conversely, GBTC shows the highest negative net fund flow of -4890M. Interestly, among the top seven ETFs, only GBTC demonstrates negative one-month net fund flow.
2.6. Bitcoin Spot ETF Technical Analysis
| Bitcoin Spot ETF | Williams % Range (20 Days) | MACD (15 Period) | 20 Day Moving Average | RSI (30 Days) | 20 Day Volatility | Current Price |
| GBTC | 45.28 | 0.04 | $60.01 | 56 | 65.37% | $59.26 |
| IBIT | 45.35 | 0.02 | $38.41 | 55 | 65.75% | $37.93 |
| FBTC | 45.07 | 0.06 | $58.93 | 55 | 65.78% | $58.23 |
| ARKB | 44.78 | 0.08 | $67.40 | 55 | 64.92% | $66.60 |
| BITB | 44.62 | 0.06 | $36.75 | 55 | 65.88% | $36.33 |
| HODL | 44.50 | 0.13 | $76.25 | 55 | 65.39% | $75.38 |
| BRRR | 45.38 | 0.01 | $19.11 | 54 | 65.10% | $18.80 |
Let’s analyse the top seven Bitcoin Spot ETFs. To do the analysis, we can use five distinct indicators: Williams % Range (20-Days), MACD (15 Period), 20 Day Moving Average, RSI (30 Days), and 20-Day Volatility.
As per the Williams % Range (20 Days) indicator, almost all the ETFs are near the oversold territory. The Williams % range (20-days) value of every ETF is below 46. An oversold condition may signal that the asset has fallen rapidly, suggesting a potential upward price reversal.
The MACD (15-Period) also indicators a bullish trend for all the ETFs, as all of them have positive values, suggesting that their short-term moving averages are above their longer-term moving averages.
The 20-Day Moving Average indicator does not favours any ETFs, as the current price of every ETF is below its 20-Day MA value.
According to the RSI (30 Days) indicator, all of the ETFs display uptrend, as none of them have an RSI value below 55.
The 20-Day Volatility indicator suggests that ARKB, with 64.92% 20-day volatility, has the lowest level of price fluctuations compared to the rest, and BITB, with 65.88% 20-day volatility, has the highest.
Endnote
As we conclude our monthly analysis of Bitcoin ETFs, we unveil a tapestry of insights into both Bitcoin futures ETFs and Spot ETFs. Through meticulous examination of parameters like one-month average volume, expense ratio, one-month return, and net fund flow, we have illuminated the performance dynamics within these ETFs. Furthermore, our in-depth technical analysis has revealed hidden patterns and trends, providing a deeper understanding of market movements. As Bitcoin ETFs continue to shape the investment landscape, may this analysis serve as a beacon of guidance for investors, empowering them to navigate the complexities of ETF markets with confidence and clarity.
Also Read How Crypto Laws & Regulations Affecting Blockchain Technology and Cryptocurrencies, Like Bitcoin, Can Impact Its Adoption.
14d ago•
bullish:
0
bearish:
0
Share

 Manage all your crypto, NFT and DeFi from one place
Securely connect the portfolio you’re using to start.

bullish:
0
bearish:
0


bullish:
0
bearish:
0
