
Dogecoin Price Prediction: $DOGE Chart Flashes Warning Signs

0
0

Dogecoin started out as a joke crypto back in 2013 and has since grown into one of the most recognized and widely held coins in the market, known for its huge retail community and its unlimited supply model.
Today, $DOGE is trading around $0.08277, down about 2.1 percent over the last 24 hours, as the coin works through a pullback on the shorter timeframe while showing a more constructive structure on the daily chart.
This Dogecoin price prediction breaks down where DOGE could be headed next.
Live Market Data
Metric | Value |
Price | $0.08277 (-2.1%) |
24h Range | $0.08108 to $0.08644 |
Market Cap | $12.889B |
Fully Diluted Valuation | $14.19B |
24h Trading Volume | $667.214M |
Circulating Supply | 155.719B |
Total Supply | 171.431B |
Max Supply | Unlimited |
Exchange Volume
Binance leads Dogecoin futures volume by a wide margin at roughly $496.02M, with OKX a distant second at $262.94M. Bybit follows at $120.86M, while WhiteBIT and Bitget both sit in the $88M to $92M range. 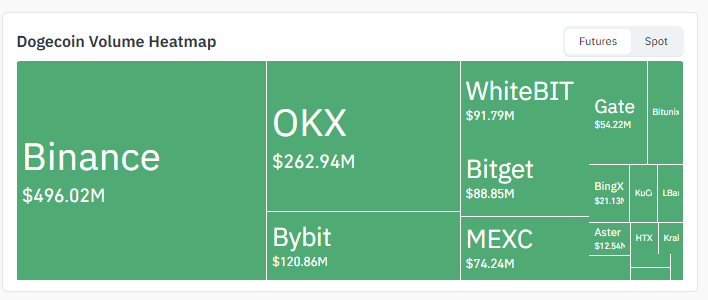
Source: Volume Heatmap Data Taken From Coinglass.
MEXC adds another $74.24M, with Gate, BingX, KuCoin, Aster, HTX, Kraken, and Bitunix rounding out a broad spread of liquidity across both major and smaller venues.
That kind of depth across so many exchanges generally supports efficient price discovery, adding weight to the technical levels being watched in this Dogecoin Price Prediction.
Liquidation Snapshot
Liquidation data over the past 24 hours shows $6.81M in total positions wiped out, with longs taking the much bigger hit at $5.98M against just $837.39K in shorts.
Zooming into the 12-hour window tells a similar story, with $5.65M in total liquidations split between $5.39M in longs and $263.28K in shorts. 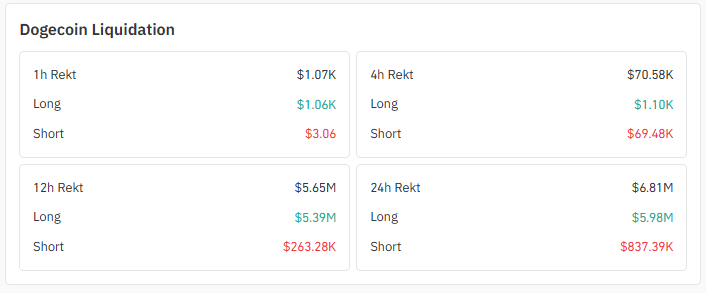
Source: Liquidation Data Taken From Coinglass.
The picture shifts sharply in the shorter windows, though the 4-hour window shows $70.58K in liquidations dominated by shorts at $69.48K against just $1.10K in longs, and the 1-hour window shows a similar tilt toward short liquidations.
That mix suggests longs absorbed most of the pain across the full day, while a fast squeeze on shorts has played out more recently, a dynamic worth watching as this Dogecoin Price Prediction develops.
Key Takeaways
DOGE is trading near $0.08277, sitting inside a descending channel on the 4H chart after a sharp rally faded into a steady pullback.
On the daily chart, DOGE recently broke a long-standing falling trendline and staged a sharp bounce, and the price is now filling an FVG gap left behind by that move.
A break above the 4H channel's upper boundary could open the door toward $0.09229, while a rejection and breakdown from the lower boundary could send DOGE toward $0.07546.
On the daily, a bounce from the FVG that holds could push $DOGE toward $0.09356 and higher, while a failed bounce could send the price back toward the $0.07340 support.
Liquidation data shows longs absorbing the bulk of the damage over the past 24 hours, even as recent hours have seen a sharper hit to shorts.
Technical Analysis
On the 4H chart, DOGE is currently trading inside a well-defined descending channel.
If the price pushes up to the upper boundary of this channel and manages to break above it, the setup favors a move toward the higher resistance zones. 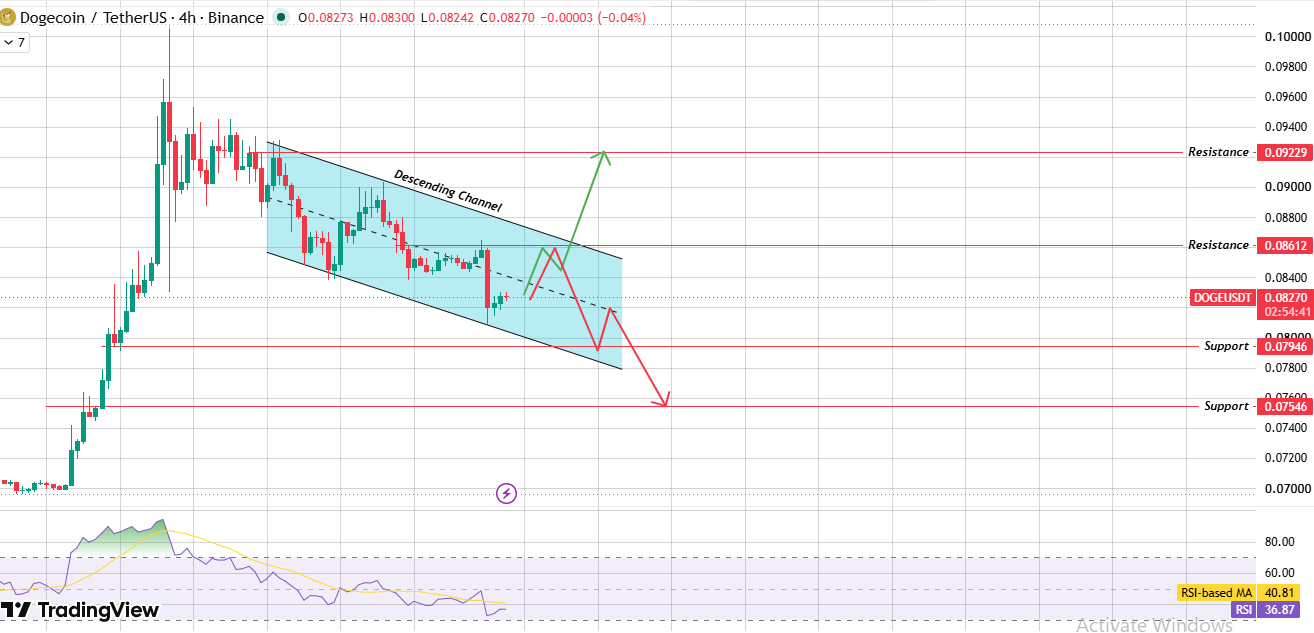
Source: Chart Taken From TradingView.
But if the price instead gets rejected at the upper boundary and rolls back down to the lower boundary, a confirmed breakdown from there would open the door toward lower support levels.
RSI on this timeframe is reading 36.87, below its own moving average of 40.81, reflecting the cooling momentum that's typical of a pullback inside a descending structure.
On the daily chart, the picture looks more constructive. DOGE broke above a long-standing falling trendline, which triggered a sharp upside bounce before the price ran into resistance and pulled back.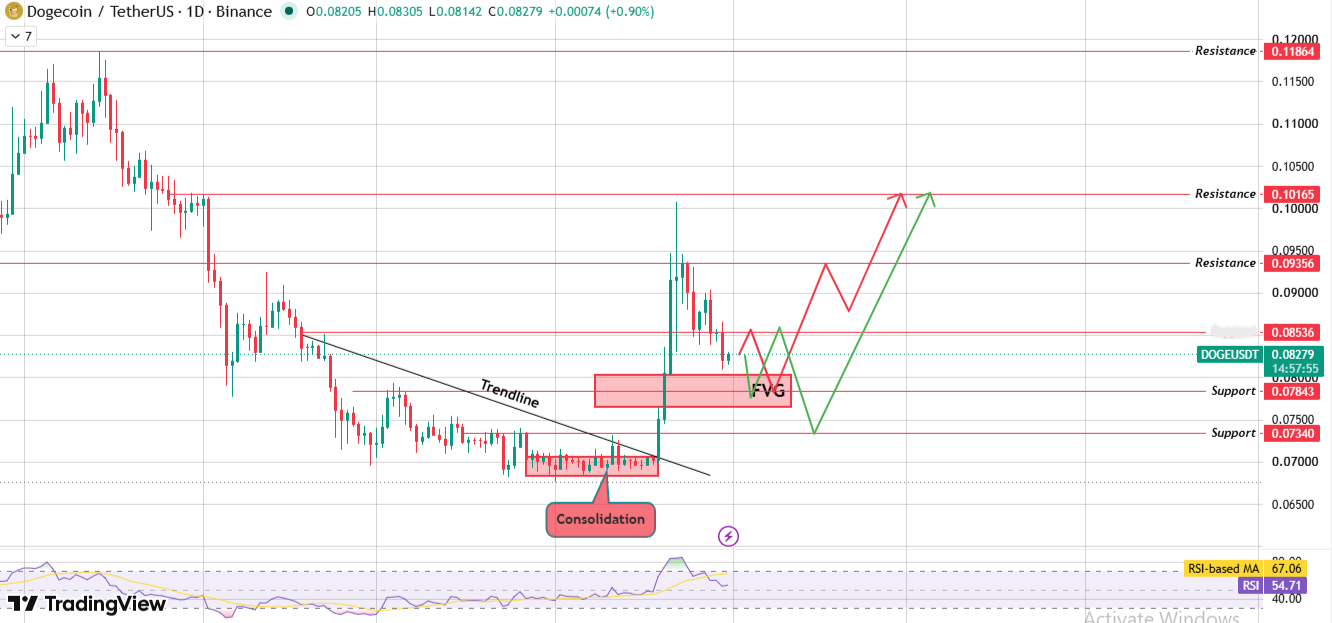
Source: Chart Taken From TradingView.
That pullback has brought DOGE into an FVG zone, a gap left behind by the speed of the earlier rally. Price is currently filling this gap.
RSI on the daily is at 54.71, still comfortably below its moving average of 67.06 after cooling off from a recent spike, consistent with a market digesting a strong move before deciding its next direction.
FVG Zone in Focus
The daily FVG is the level to watch for this Dogecoin price prediction.
If price finds support inside this gap and bounces, the setup opens toward the $0.09356 resistance and potentially higher toward $0.10165 and $0.11864 if momentum builds.
If the bounce fails to hold and the price cannot sustain itself above the gap, $DOGE could slide back down toward the $0.07843 and $0.07340 support levels.
Descending Channel in Focus
On the shorter 4H timeframe, the descending channel is the more immediate structure in play.
A clean break and hold above the channel's upper boundary near $0.08612 would be the first sign of short-term strength, opening a path toward $0.09229.
A rejection here, followed by a breakdown of the channel's lower boundary, would instead point toward the $0.07546 support as the next area buyers may look to defend.
Support and Resistance Levels
Daily Chart
Level Type | Price |
Resistance 4 | $0.11864 |
Resistance 3 | $0.10165 |
Resistance 2 | $0.09356 |
Resistance 1 | $0.08536 |
Current Price | $0.08279 |
Support 2 | $0.07843 |
Support 3 | $0.07340 |
4H Chart
Level Type | Price |
Resistance 2 | $0.09229 |
Resistance 1 | $0.08612 |
Current Price | $0.08270 |
Support 1 | $0.07946 |
Support 2 | $0.07546 |
Bull, Base, and Bear Case
Scenario | Level | Setup | Invalidation |
Bull | $0.09229 to $0.11864 | 4H channel breaks up and daily FVG bounce holds, price clears $0.09356 with volume | Rejection at $0.09229 / $0.09356 and drop back into the FVG |
Base | $0.07946 to $0.08612 | Price continues chopping inside the 4H descending channel and daily FVG zone. | Break of either the 4H channel's lower boundary or the daily $0.08536 support |
Bear | Below $0.07546 | The 4H channel breaks down, the daily FVG bounce fails, and support beneath it breaks. | Reclaim of $0.07946 on the 4H and the FVG structure on the daily |
Expert Opinion
Analysts following this Dogecoin price prediction see the current setup as a market at a genuine crossroads across two different timeframes.
The 4H descending channel suggests near-term caution is still warranted, while the daily trendline breakout and FVG test are viewed as a potentially larger structural shift that hasn't been fully confirmed yet.
Most technical voices want to see $DOGE hold the daily FVG and reclaim the 4H channel's upper boundary before turning more confident about a run toward the higher resistance levels, while a failure on both fronts would quickly shift attention back toward the lower support zones.
Glossary
Descending Channel: A downward-sloping price structure formed by a series of lower highs and lower lows, reflecting consistent selling pressure.
Falling Trendline: A downward-sloping line connecting a series of lower highs, whose price breaking above can signal a potential trend shift.
FVG (Fair Value Gap): A zone on the chart where price moved so fast that it left a gap in normal trading activity, which price often returns to test before continuing its trend.
RSI: Relative Strength Index, a momentum indicator measuring how fast and how much price has moved recently, typically read on a scale of 0 to 100.
Liquidation: The forced closing of a leveraged trading position when losses eat up a trader's margin, common in futures markets.
Support Level: A price zone where buying pressure has historically stepped in to slow or reverse a decline.
Resistance Level: A price zone where selling pressure has historically capped further gains.
Methodology
This Dogecoin Price Prediction is built using both the 4H and daily chart patterns, including the descending channel, the falling trendline breakout, the marked FVG zone, support and resistance levels, and RSI readings, combined with current exchange volume and liquidation data.
All price levels referenced are taken directly from the charts provided and are not extrapolated beyond what the pattern shows.
Disclaimer: This article is for informational purposes only and should not be treated as financial advice. Cryptocurrency markets are highly volatile, and prices can move sharply in either direction within short periods. Always do your own research and consult a qualified financial advisor before making any investment decisions.
0
0

 Manage all your crypto, NFT and DeFi from one place
Securely connect the portfolio you’re using to start.


