Daily Market Review: BTC, ETH, UMA, CEL, XVG
11d ago•

bullish:
0
bearish:
0
Share

Today’s market session has seen consolidations everywhere as evidenced by the minimal change in the global market cap. The total cap stood at $2.26T as of press time, representing a 1.19% drop over the last 24 hours while the trading volume stood at $63.75 as of the same period, representing a 0.51% increase over the last 24 hours.
Bitcoin Price Review
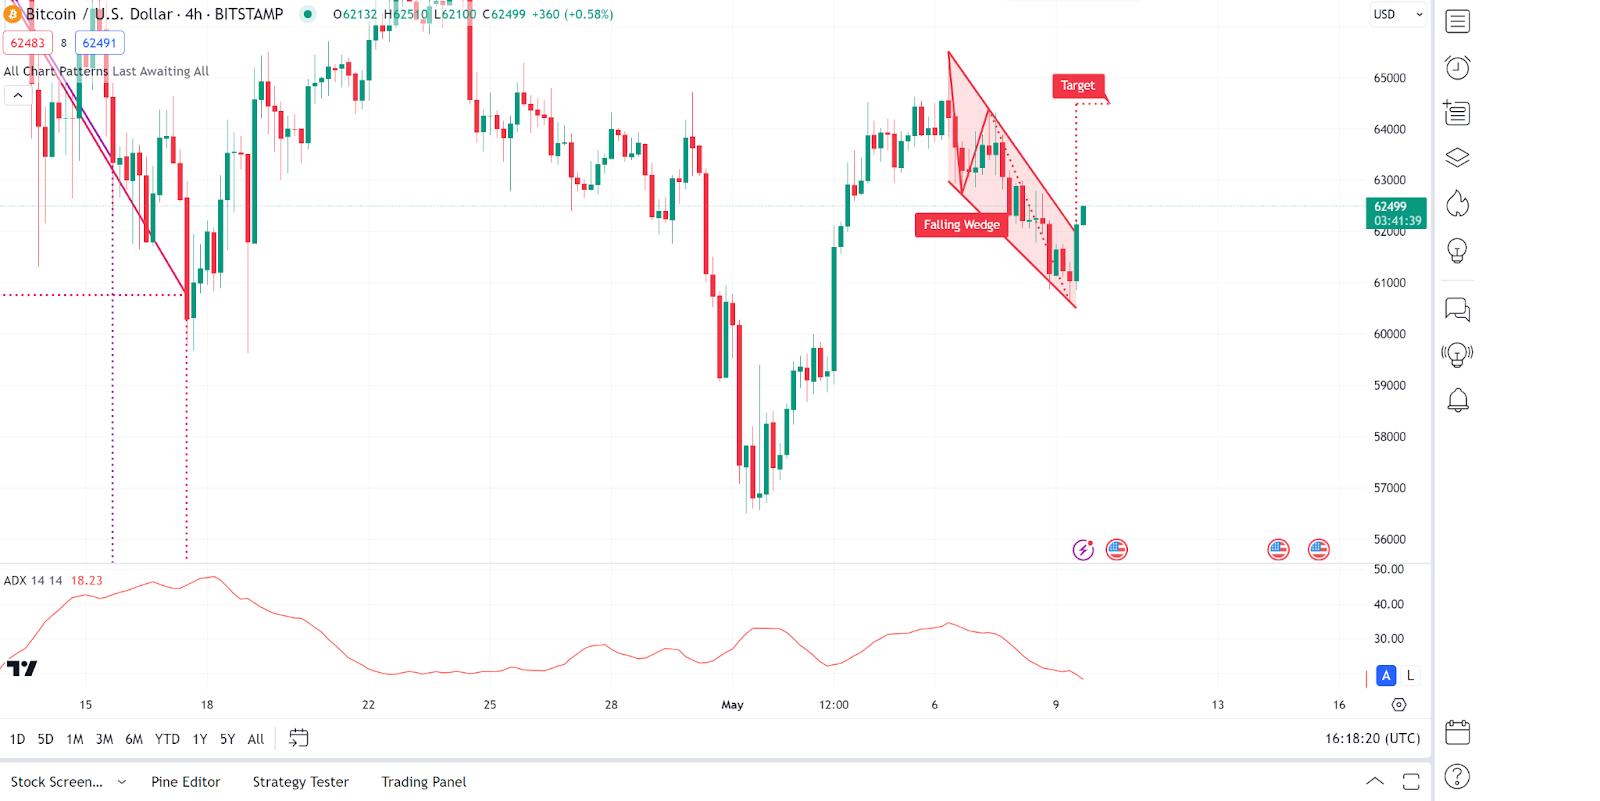
Bitcoin (BTC) is facing consolidations as evidenced by its price movements in today’s session. Looking at an in-depth analysis, we see that the chart shows a Falling Wedge formation, typically a bullish pattern suggesting a possible reversal or upward price breakout. The wedge formation is characterized by converging trend lines enclosing a price movement that’s sloping downward.
On the other hand, the ADX (Average Directional Index) appears to be declining, which indicates that the current downtrend is losing strength, supporting the potential bullish reversal indicated by the wedge pattern. As of press time, the Bitcoin price stood at $62,382, representing a minor 0.14% increase from its previous 24-hour price.
Ethereum Price Review
Ethereum (ETH) is also another gainer in today’s session as seen from its price movements. Analysing Ethereum price charts, we see that the Ethereum price is fluctuating within Bollinger Bands, showing a recent bounce off the lower band, which can be interpreted as a potential buy signal in the context of trading within the bands.
On the other hand, the MACD (Moving Average Convergence Divergence) shows a slight bullish convergence as the bars on the histogram are increasing in height, suggesting a strengthening in upward momentum. As of press time, the Ethereum price stood at $3,012, representing a minor 0.17% increase from its previous 24-hour price.

UMA Price Review
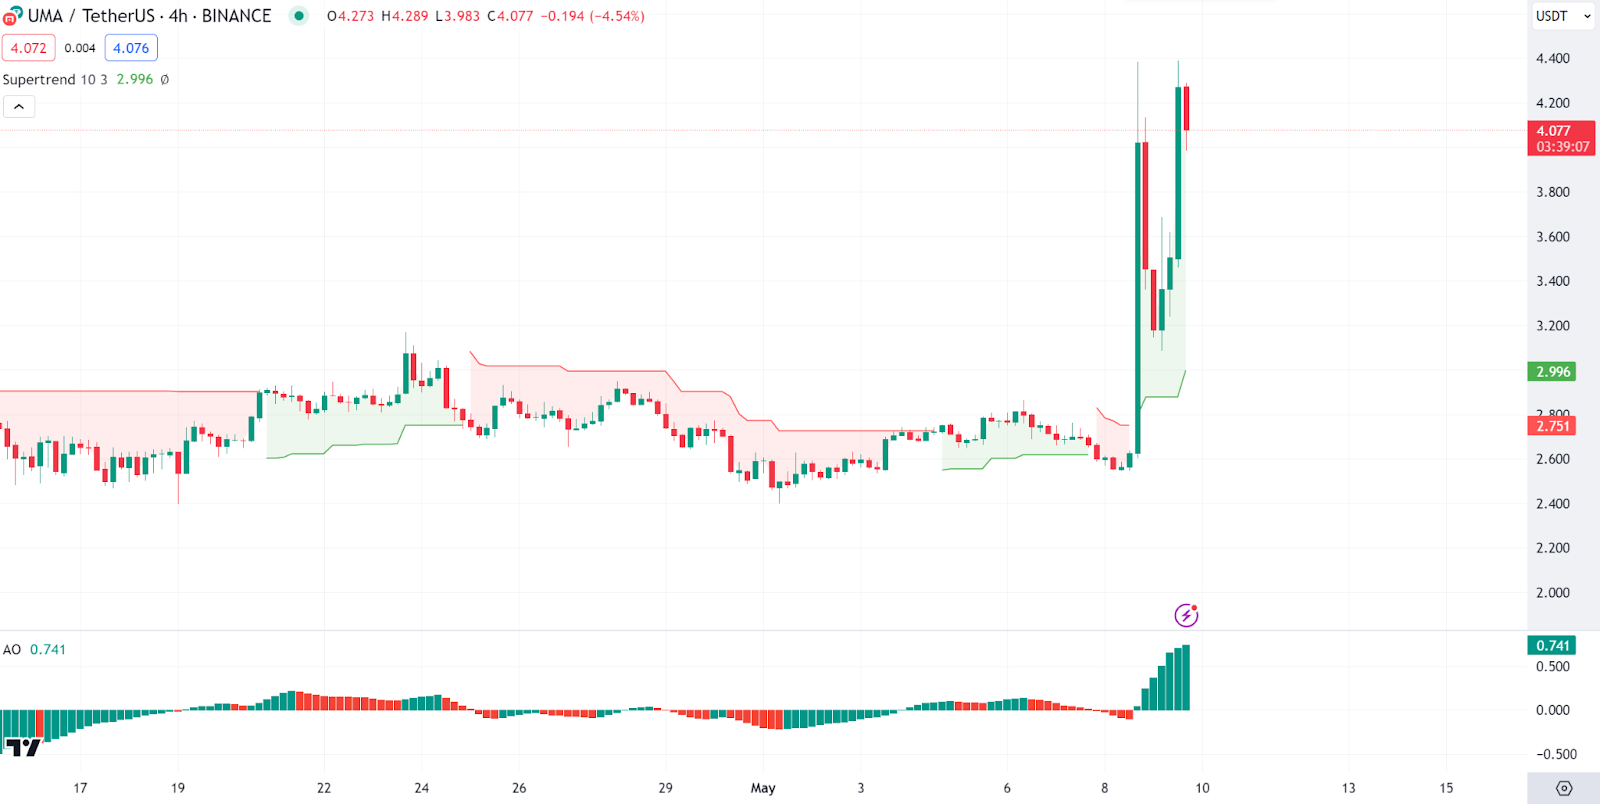
UMA (UMA) is also another gainer in today’s session as evidenced by its price movements in today’s session. Looking at an in-depth analysis of UMA price charts, we see that there is a recent sharp upward movement, breaking away from its previous sideways trend. This sudden increase suggests a strong buying pressure.
On the other hand, the AO (Awesome Oscillator) is showing a strong green bar, reinforcing the bullish movement depicted by the sharp price rise. As of press time, the UMA price stood at $4.04, representing a minor 53.92% increase from its previous 24-hour price.
Celsius Price Review
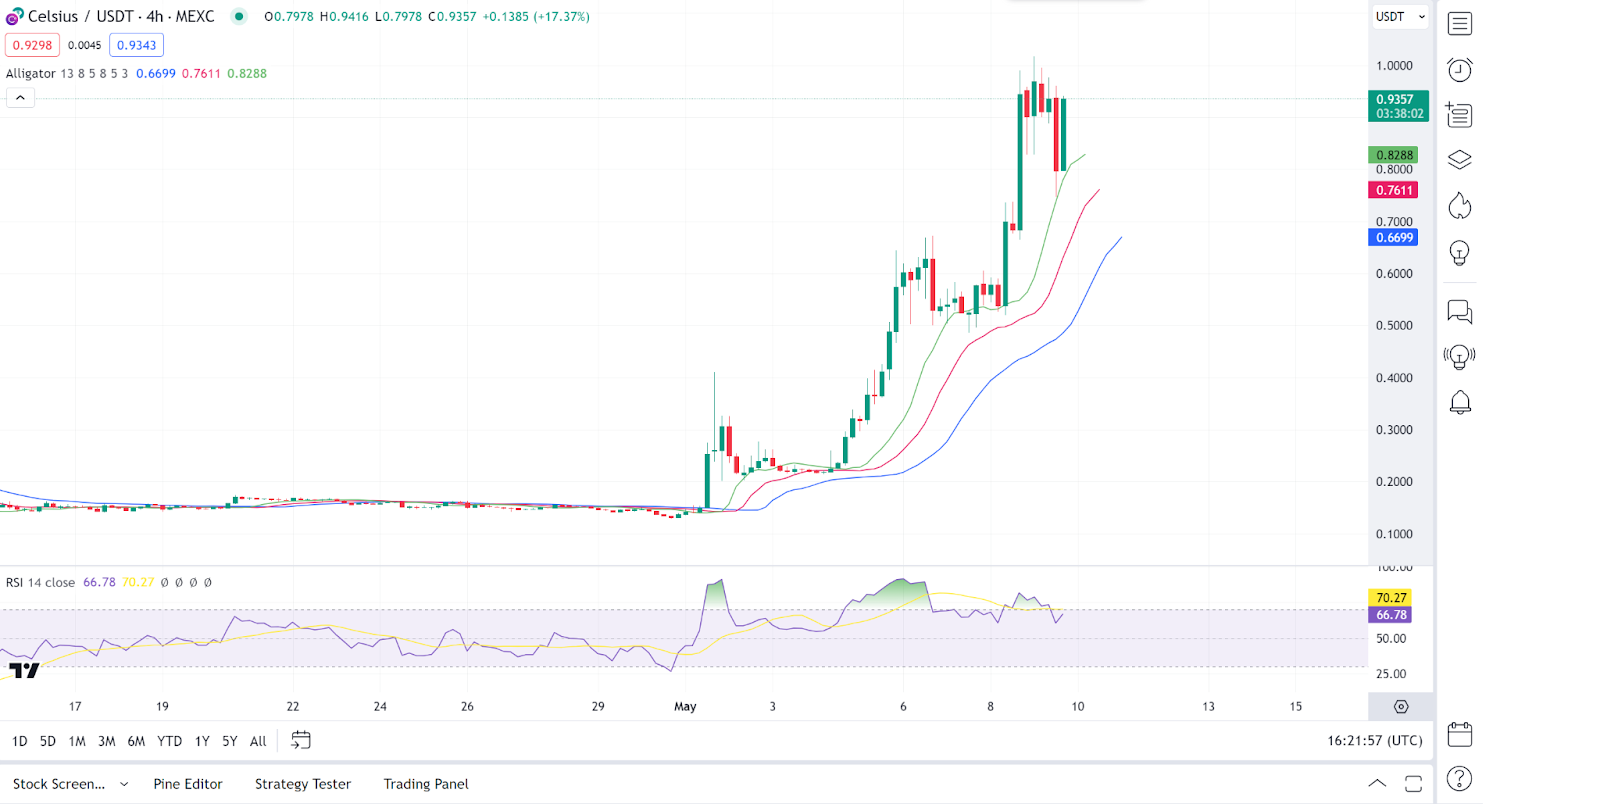
Celsius (CEL) is also another gainer in today’s session as evidenced by its price movements in today’s session. Looking at an in-depth analysis, we see that the UMA price charts show a rapid uptrend followed by some price retracement, which could be a bull flag pattern suggesting a continuation of the uptrend after a brief consolidation.
On the other hand, the RSI (Relative Strength Index) is in the higher range, around 70, indicating that the asset might be becoming overbought, which could precede a short-term pullback or consolidation. As of press time, the Celsius price stood at $0.9371, representing a minor 14.5% increase from its previous 24-hour price.
Verge Price Review
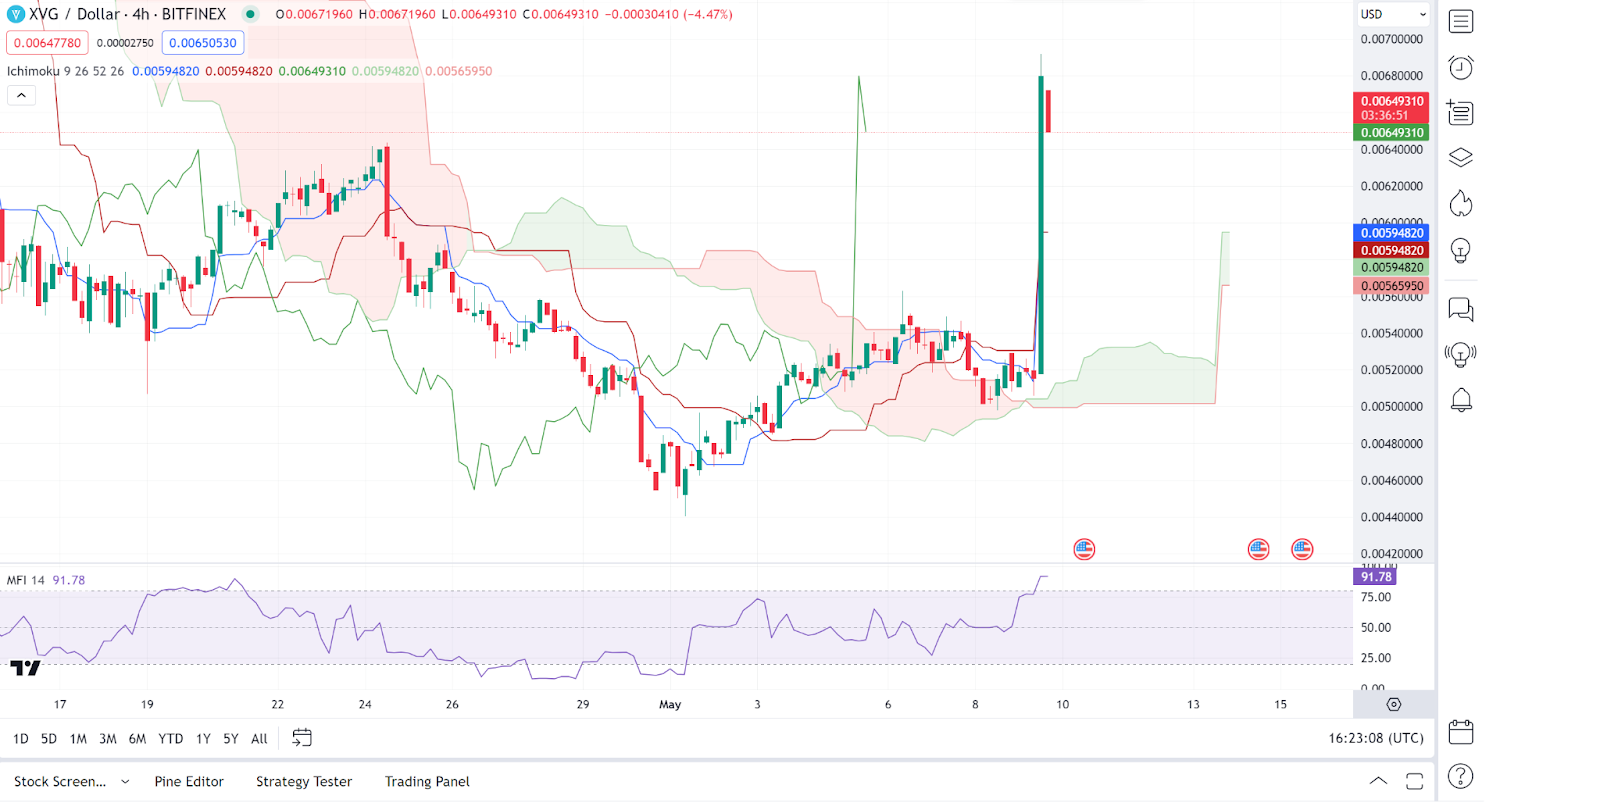
Verge (XVG) is also another gainer in today’s session as seen from its price movements today. The Verge price has shown a dramatic upward spike after a period of consolidation. This kind of movement may suggest strong buying interest or a reaction to some catalyst.
On the other hand, the MFI (Money Flow Index) is very high, at 91.78, indicating that the price might be in the overbought zone. This could lead to potential profit-taking and a price correction. As of press time, the Verge price stood at $0.006293, representing a minor 21.8% increase from its previous 24-hour price.
11d ago•
bullish:
0
bearish:
0
Share

 Manage all your crypto, NFT and DeFi from one place
Securely connect the portfolio you’re using to start.

bullish:
1
bearish:
0

bullish:
0
bearish:
0

bullish:
0
bearish:
0
