Polygon (MATIC) Faces Bearish Rejection: Insights on Market Sentiment
8d ago•

bullish:
0
bearish:
0
Share

Polygon’s (MATIC) price has rejected Ichimoku Cloud, indicating a bearish sentiment, with $0.616 acting as key support.
In this analysis, we will discuss key zones for placing orders and the fundamental outlook for MATIC.
Polygon Price Analysis
Polygon’s price has rejected the daily Ichimoku Cloud, signaling ongoing bearish sentiment. The level of $0.616 appears to be serving as a key support price level.
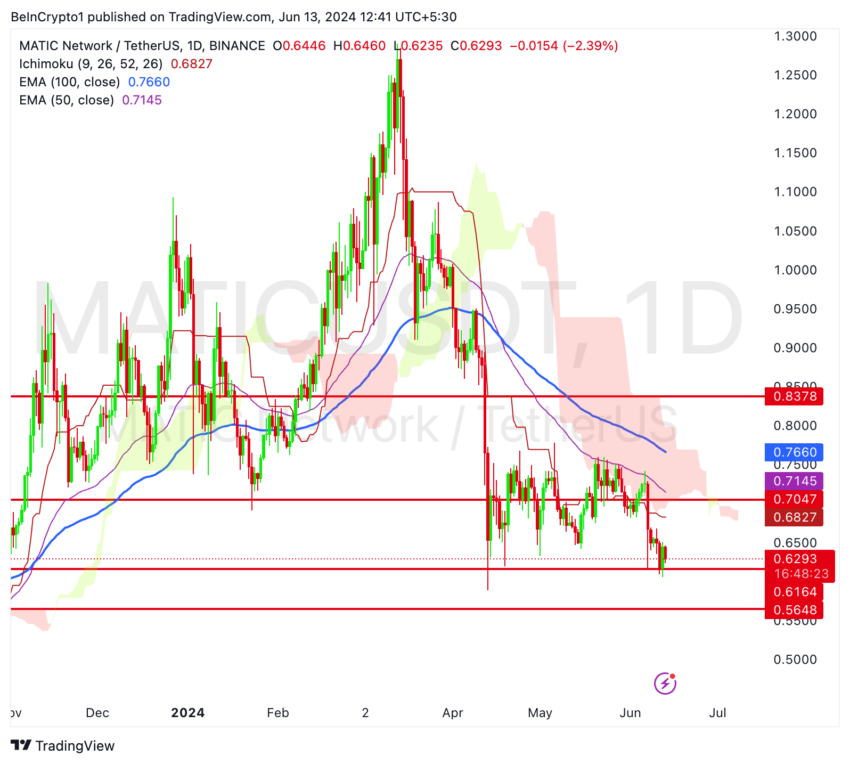 MATIC Price Analysis. Source: TradingView
A break and close above the 100-day EMA (blue line) at $0.766 would be a strong bullish signal, suggesting the possibility of a trend reversal.
Watch for the price to surpass the Ichimoku Baseline (red line) at 0.$682. This move would indicate an easing of bearish pressure and potential for upward momentum for Polygon.
Analysis of MATIC Inflows to Exchanges
The total inflow volume to exchanges measures the amount of MATIC transferred to exchanges, serving as a key indicator of market sentiment. An increase in inflows typically suggests potential selling pressure.
On June 4, the total inflow volume to exchanges stood at approximately 3.96 million MATIC. By June 12, this volume had surged to around 13.98 million MATIC, reflecting a significant increase of 10 million MATIC.
Read More: How To Buy Polygon (MATIC) and Everything You Need To Know
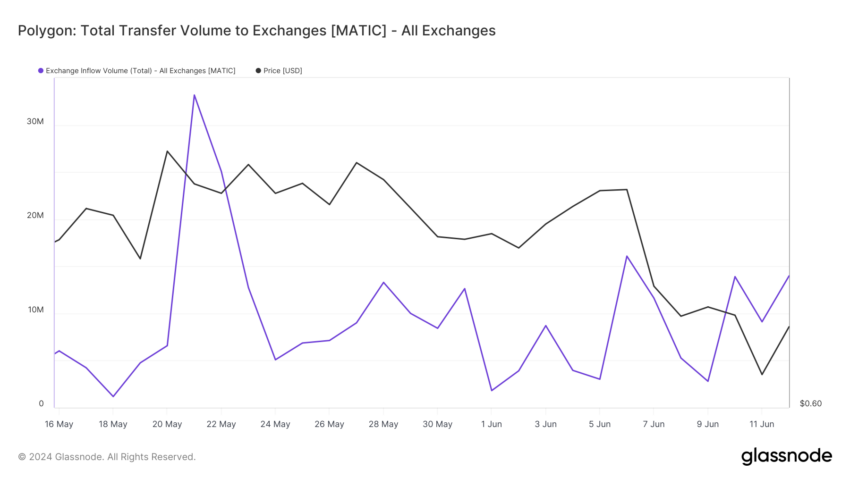 MATIC Inflows to Exchanges. Source: Glassnode
This substantial rise indicates rising activity and possibly increased selling pressure. Throughout this period, the inflow volume exhibited considerable daily fluctuations. Notably, on June 6, the volume spiked dramatically by 13 million MATIC.
The standard deviation for this period was approximately 6.94 million MATIC, highlighting the high volatility in inflow volumes.
The analysis of total inflow volume to exchanges on Polygon from June 4 to June 12 reveals a period of significant volatility, marked by substantial increases in inflow volumes.
A Surge in MATIC Outflows Signals Strong Accumulation
Total outflow volume from exchanges measures the amount of MATIC withdrawn from exchanges. This metric provides insights into market sentiment, as increased outflows often suggest that investors are accumulating or holding onto their assets rather than selling.
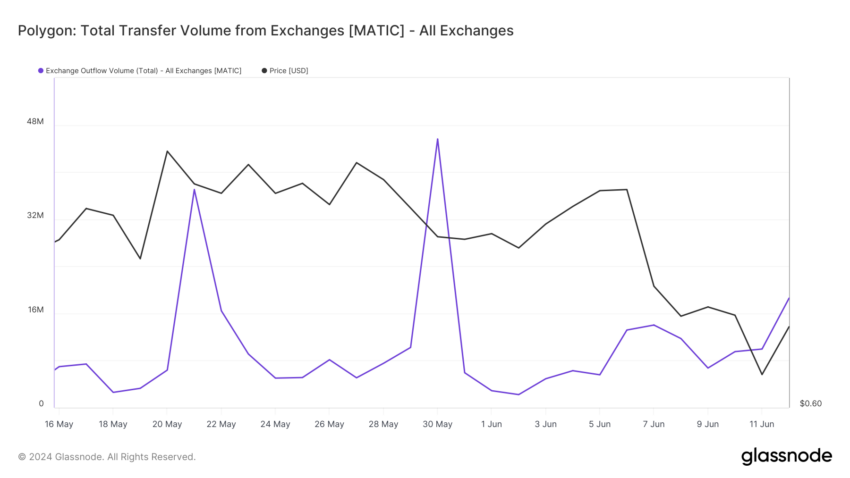 MATIC Outflows from Exchanges. Source: Glassnode
On June 4, the total outflow volume from exchanges was approximately 6.28 million MATIC. By June 12, this figure had surged to 18.59 million MATIC, representing a substantial increase of 12.31 million MATIC.
During this period, daily fluctuations in outflow volume were significant. For instance, on June 6, the volume experienced a sharp spike of 7.60 million MATIC. The standard deviation for the outflow volume during this timeframe was around 9.62 million MATIC, indicating a high degree of volatility in the market.
Outflow to Inflow Volume Ratio
The outflow-to-inflow volume ratio is a critical metric that compares the amount of MATIC transferred out of exchanges (outflow) to the amount transferred into exchanges (inflow). This ratio provides insights into market sentiment and investor behavior, helping us understand potential buying or selling pressures in the market.
On June 11, the outflow-to-inflow volume ratio dropped below 1, indicating higher inflows than outflows. This suggests potential selling pressure since more MATIC was being moved into exchanges, possibly for sale.
However, on June 12, the ratio climbed back above 1, reaching approximately 1.33. This shift indicates that outflows once again surpassed inflows, suggesting a potential return to accumulation or holding behavior among investors. This change in ratio is significant as it reflects a shift in market sentiment from potential selling pressure back to potential buying pressure.
Read More: Polygon (MATIC) Price Prediction 2024/2025/2030
High inflows increase the supply of MATIC on exchanges, which could drive prices down if demand does not match the supply. Conversely, high outflows reduce the supply of MATIC on exchanges, potentially leading to price increases if demand remains constant or rises.
As highlighted in Polygon’s Price Analysis section, MATIC is currently in a downward trend, presenting an investment opportunity during this price correction. Investors should monitor key support and resistance levels on the technical chart and use stop losses to mitigate risks.
8d ago•
bullish:
0
bearish:
0
Share

 Manage all your crypto, NFT and DeFi from one place
Securely connect the portfolio you’re using to start.

bullish:
0
bearish:
0

bullish:
0
bearish:
0

bullish:
0
bearish:
0

bullish:
0
bearish:
0