
Cosmos Price Prediction: Is ATOM Ready for a Bigger Breakout?

0
0

ATOM is up 8.01% in the last 24 hours to $1.37, and this move comes with a real jump in volume, up 153.08% to $53.14 million.
This Cosmos price prediction comes down to whether that volume can push
$ATOM through the descending channel it has been trading inside since May.
A setup tied to the wider altcoin price prediction picture and the ongoing ATOM technical analysis traders have been watching for weeks.
Why Is ATOM Suddenly Waking Up Today?
On July 28, Cosmos Hub published its first Cosmos Quarterly update, laying out a new three-pillar structure for Cosmos Labs, a two-year review of its evolving thesis, a Q2 update spanning ecosystem, open source, and enterprise work, and progress on CBWeb3, its push into central bank money and cross-border payments over IBC.
That update landed about a week before today’s volume spike, and it comes at a point where ATOM has had little to celebrate, down 28.80% year to date and 67.90% over the past year.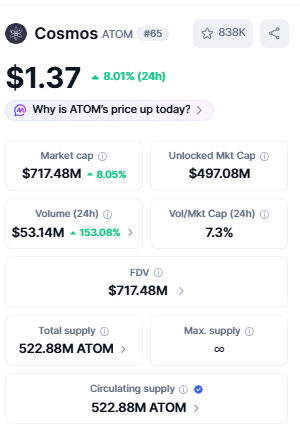
Market cap is up 8.05% to $717.48 million, and the volume to market cap ratio now sits at 7.3%, a level that shows today’s move has real participation behind it, not just a quiet drift.
Data source: CoinMarketCap
Who’s Getting Squeezed, Longs or Shorts?
Over the last 24 hours, $277.34K got liquidated in total, and shorts took the overwhelming share at $267.09K against just $10.25K from longs, a clear squeeze tied to today’s jump.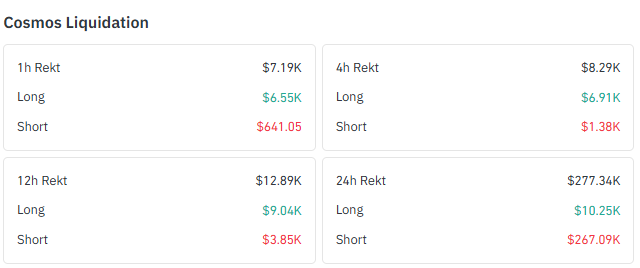
The shorter windows tell a calmer story, though. In the past 1 and 4 hours, longs have taken slightly more of the liquidations, suggesting the squeeze has already cooled off.
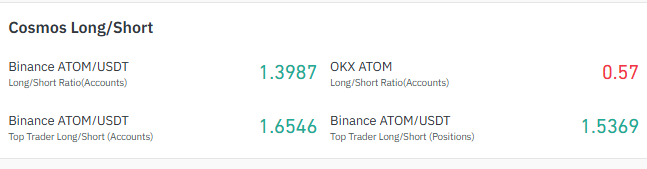
Positioning is mixed across venues; Binance’s ATOM/USDT ratio reads 1.3987 and its top trader accounts are more long at 1.6546, while OKX actually skews short at 0.57.
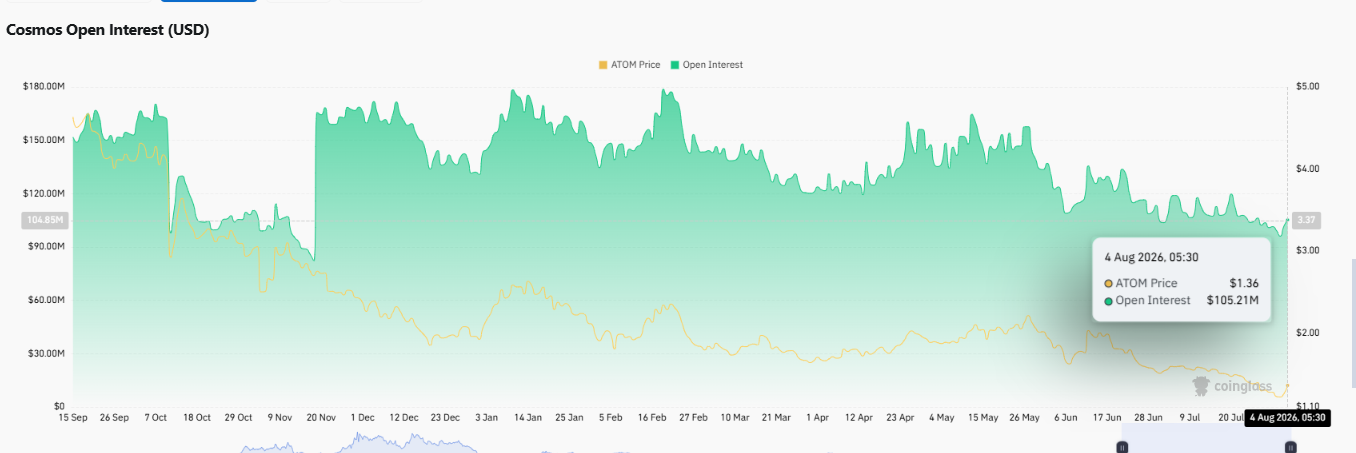
Open interest is $105.21 million, well below the levels seen months ago, so this bounce is not being driven by a fresh wall of leverage.
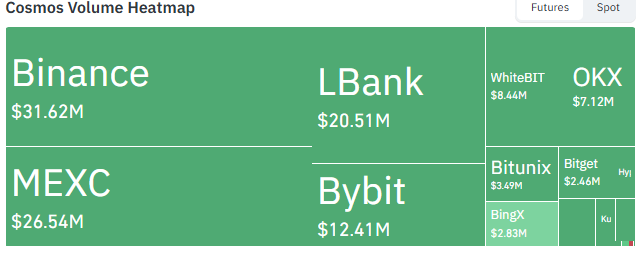
Binance leads futures volume at $31.62 million, with MEXC and LBank behind at $26.54 million and $20.51 million.
Data source: coinglass
What This Multi-Month Chart Setup Is Showing
ATOM has been trading inside a descending channel since May, and today’s daily candle is currently trading at $1.373. As per the TradingView data.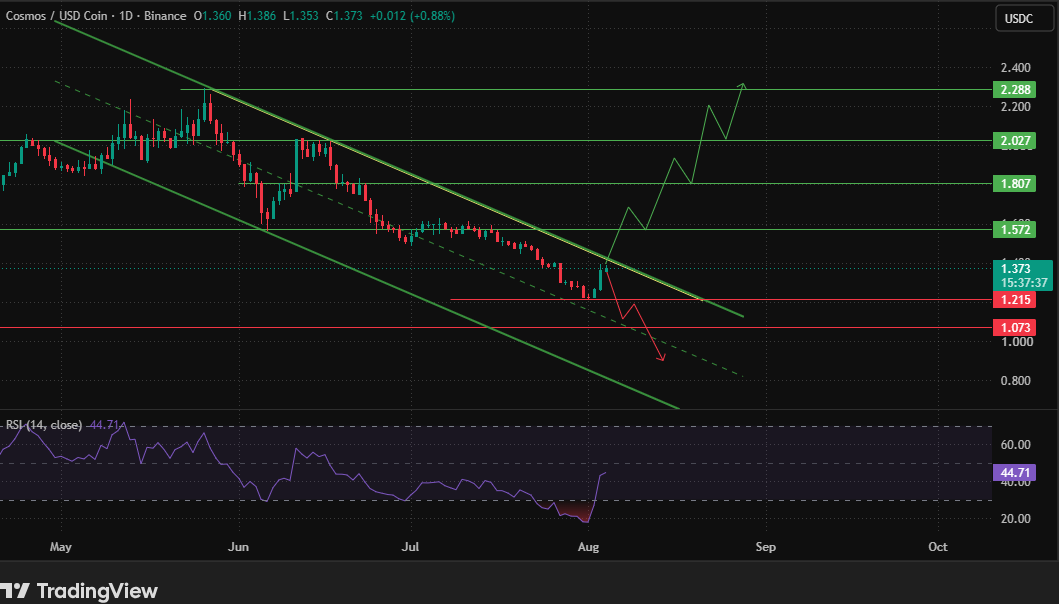
RSI sits at 44.71, still under neutral but climbing out of an oversold dip from late July.
A break above the channel points toward $1.572, then $1.807, $2.027, and $2.288 further out. If $ATOM fails to hold here, $1.215 comes into view, with $1.073 as a deeper level below that.
So, Where Could ATOM Go From Here?
Scenario | Daily Chart |
Bullish | Breaks the descending channel and clears $1.572, opening the path to $1.807, then $2.027 and $2.288 |
Base | Holds near $1.373 while RSI continues to climb out of oversold territory |
Bearish | Fails to hold current levels, sliding toward $1.215 and possibly $1.073 |
As per the Coingabbar analyst, $ATOM is testing the top of a descending channel that has held since May, and it is doing so with volume that is well above its recent average.
RSI at 44.71 has room to run before it gets stretched, which favors the case for a genuine push higher rather than a short-lived spike.
That said, the channel has not broken yet, and $1.572 remains the level that would confirm it.
Until that happens, $1.215 stays the level to watch on the downside if today’s strength fades.
Disclaimer: This analysis is for informational purposes only and does not constitute financial advice. Cryptocurrency markets are volatile, and readers should conduct their own research before making investment decisions.
0
0

 Manage all your crypto, NFT and DeFi from one place
Securely connect the portfolio you’re using to start.

0
0

0
0

0
0

0
0