
Sui Price Prediction September 2026: DeFi Yields Fuel SUI Hopes

0
0

$SUI is standing right at a level that has rejected it twice before, and this time feels different for traders who've been watching the chart closely.
A third test of the same resistance often carries more weight than the first two combined, and this Sui price prediction September 2026 breaks down exactly what needs to happen for that pattern to finally break.
Fresh yield activity is also picking up across the ecosystem, adding another layer to a setup already worth watching.
Sui Price Today: Live Data and 24-Hour Change
$SUI is trading near $0.8040 on the weekly chart. Separate live data from CoinGlass puts the coin around $0.8041, down roughly 0.94% over the past 24 hours, with futures volume of $1.00 billion against spot volume of $233.66 million and open interest at $656.49 million.
Market cap stands at $3.29 billion on a circulating supply of 4.07 billion SUI, against a total and max supply of 10 billion tokens, meaning close to 41% of all SUI that will ever exist is currently in circulation.
Source: TradingView (SUI/USDT perpetual, Binance, weekly chart) and CoinGlass, both accessed August 25, 2026, IST.
Sui News: Yield Opportunities Draw Fresh Attention
BSCNews highlighted roughly 34 minutes before this piece that SUI holders can earn over 50% APY through select DEX and lending pools on the network, based on data pulled from Elan Insights' income dashboard.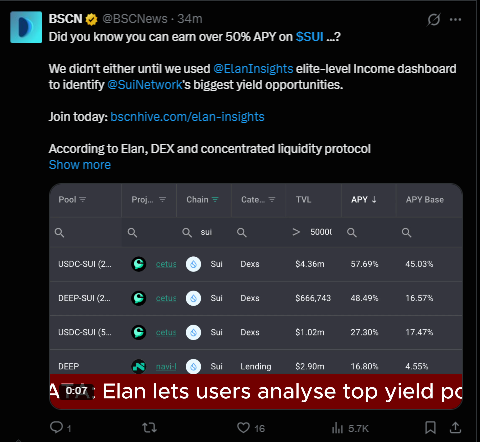
Several USDC-SUI and DEEP-SUI liquidity pools on Cetus were shown offering APYs ranging from roughly 17% to over 57%, depending on the pool.
Yield opportunities like this tend to pull capital into a network's DeFi layer, which can add steady buy-side pressure separate from pure price speculation.
Source: X post by @BSCNews, posted roughly 34 minutes before this piece, August 25, 2026.
Quick Take
CMP: $0.8040
Weekly trigger: close above $1.4147, opens $2.0274, then $3.1571
Weekly failure: close below $0.6510 invalidates the bullish structure
Data as of August 25, 2026, IST
Short risk note: these levels come from the weekly chart and depend on confirmed weekly closes, not intraday wicks.
Leveraged positions around these zones carry liquidation risk if price whipsaws before a level is confirmed.
Sui Technical Forecast September 2026
$SUI has spent months capped by a long descending trendline, and price is currently sitting at that trendline's resistance for the third time.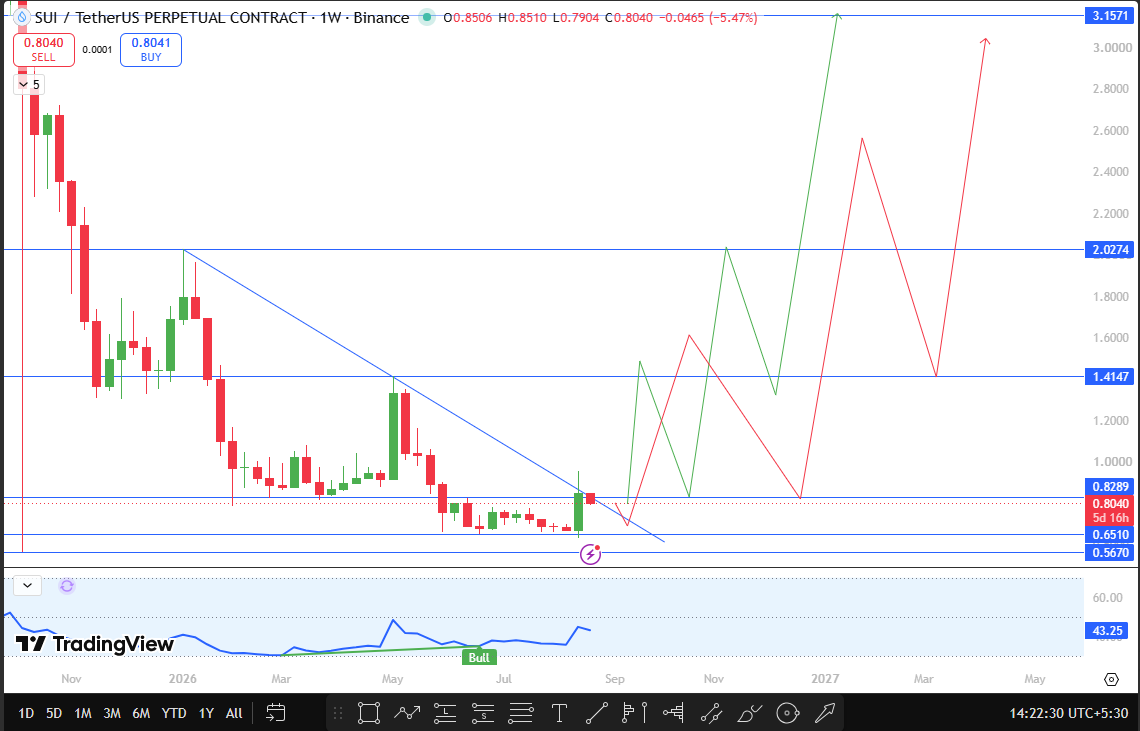
A third tap at the same level often carries extra significance, since it shows sellers have defended the same zone repeatedly, but each defense also chips away at how much supply is left to keep doing so.
For this breakout to actually confirm, SUI needs to break and close a weekly candle above $1.4147, not just poke through it intraday.
Once that happens, the next resistance opens up at $2.0274, followed by $3.1571 further out.
On the downside, a weekly close below $0.6510 would invalidate this bullish structure entirely, suggesting the third tap failed the same way the first two did.
Source: TradingView, SUI/USDT perpetual chart, 1-week timeframe, Binance, captured August 25, 2026, IST.
Sui Support and Resistance Levels to Watch
Level Type | Price | Note |
Support | $0.6510 | 1W close below this invalidates the bullish setup. |
Support | $0.5670 | The next chart-marked reference is below $0.6510. |
Resistance | $1.4147 | The weekly close above this confirms the trendline breakout. |
Resistance | $2.0274 | First target after breakout confirmation |
Resistance | $3.1571 | Second target on continued strength |
Sui Price Prediction: Bull, Base, and Bear Cases
The base case has $SUI continuing to test the descending trendline resistance through most of September, without a confirmed weekly close above $1.4147 or below $0.6510.
The bull case activates on a close above $1.4147, which opens a path toward $2.0274 and eventually $3.1571.
This case gets extra support from growing DeFi yield activity across the network, which points to real usage building alongside the technical setup.
The bear case needs a close below $0.6510, which would confirm the trendline has rejected $SUI for a third straight time and put the broader downtrend back in control.
Every one of these Sui price prediction September 2026 scenarios depends on a confirmed weekly close, not a temporary wick through any level.
September 2026 Catalysts That Could Move SUI
Continued growth in SUI's DeFi yield opportunities is the clearest catalyst heading into September, since deeper liquidity pools tend to support price during consolidation phases.
If activity around these pools keeps expanding, it strengthens the case for a breakout above $1.4147.
The broader direction of Bitcoin and Ethereum will also shape how much of this bullish SUI price outlook for September 2026 actually plays out.
Risks That Could Invalidate This Forecast
This bullish setup fails if price cannot close a 1W candle above $1.4147 and fails more seriously if the price closes below $0.6510, which opens $0.5670 next.
Broader risks include shifts in Bitcoin dominance, macro liquidity conditions, and general crypto market volatility, any of which could override Sui's own chart structure regardless of where its trendlines sit.
Glossary
Descending trendline: a downward-sloping line connecting a series of lower highs, used to track a prevailing downtrend
Third tap: the third time price tests the same trendline or resistance level, often seen as a higher-conviction breakout or rejection point
Weekly close: the final traded price when a weekly candle finishes, used to confirm whether a breakout or breakdown is genuine
Open interest: the total number of outstanding futures or options contracts that have not yet been settled
Support: a price zone where buying pressure has previously stepped in
Resistance: a price zone where selling pressure has previously capped upside
Invalidation level: the price point at which a forecast scenario is considered incorrect
Disclaimer
This article is for informational purposes only and does not constitute financial advice. Cryptocurrency markets are highly volatile, and all price levels discussed are based on technical chart analysis, not a guarantee of future performance. Readers should conduct their own research before making any investment decisions.
0
0

 Manage all your crypto, NFT and DeFi from one place
Securely connect the portfolio you’re using to start.


