
XRP Price Prediction: Ali Martinez Signals Breakout, Eyes 10% Rally

0
0
XRP is trading near $1.50 today, and traders are watching one number: $1.54. The crypto market is also up 1.15% and sits near $2.89 trillion.
Analyst Ali Martinez says a short-term breakout may be close. His view comes from a pattern on the hourly chart.
XRP Price Today: How Much Is XRP Trading For?
The latest data shows XRP at $1.5059, up 0.49% on the day. Market cap is about $95.02 billion.
Here is a quick look at the main numbers.
Metric | Value |
Price | $1.5059 |
24h change | +0.49% |
Market cap | $95.02B |
Futures volume (24h) | $4.40B |
Spot volume (24h) | $806.91M |
Open interest | $3.58B |
Circulating supply | 63.09B |
Total supply | 99.98B |
Max supply | 100.00B |
Futures volume fell 14.73% to $4.40 billion. That means fewer trades happened compared with the day before.
XRP News Today: What Is Ali Martinez Saying?
Martinez posted that the token is building a symmetrical triangle on the 1-hour chart. He called $1.54 "the level to watch."
He wants an hourly close above $1.54 before calling it a breakout. A close is the price at the end of the one-hour candle, not just a quick spike.
If that happens, he says the move could bring a rally of roughly 10%. That points to the $1.70 area.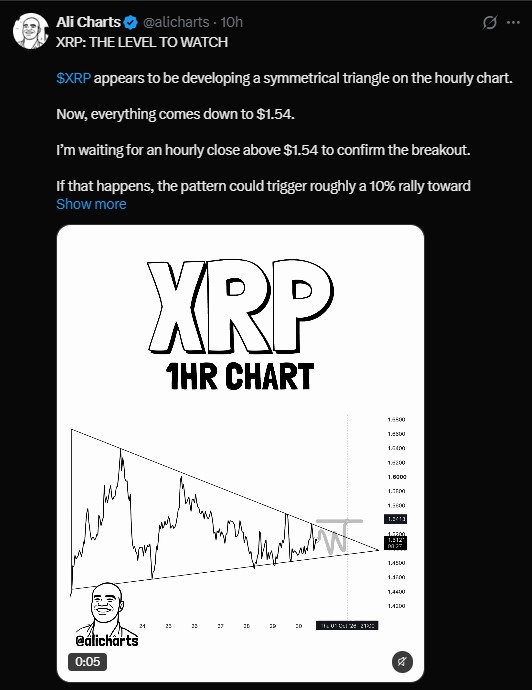
What Is a Symmetrical Triangle on the XRP Chart?
A symmetrical triangle forms when price makes lower highs and higher lows. The two trendlines squeeze closer together.
On the chart, the upper line slopes down from the early peak. The lower line slopes up from the recent lows. Price now sits close to the point where they meet.
Price usually has to leave the triangle at some point. It can go up or down. The pattern alone does not say which way.
XRP Price Forecast: Key Levels to Watch
The chart gives a simple map for the next few hours and days. Nothing here is certain.
Level | What it means |
$1.5059 | Current price |
$1.54 | Breakout trigger (hourly close needed) |
$1.70 | Martinez target, about 10% above the trigger |
Lower triangle line | Support to watch if price slips |
The gap from $1.5059 to $1.54 is about 2.3%. That is a small move for this market.
A 10% rise from $1.54 lands near $1.69, so $1.70 is a rounded target. A close back under the rising lower line would weaken the setup.
XRP Latest News: What Do Futures and Options Data Show?
As per CoinGlass data, Open interest rose 2.71% to $3.59 billion. More open contracts can mean traders are adding positions.
Options are heating up too. Options volume jumped 139% to $10.03 million. Options open interest rose 5.74% to $71.85 million.
These numbers are small next to futures. Still, a big jump in options volume shows growing interest in where the price goes next.
Are Traders Betting Long or Short on XRP?
Most account data leans long. But the 24-hour overall ratio is below 1, so the picture is mixed.
Long/short data | Ratio |
Long/Short (24h) | 0.8692 |
Binance XRP/USDT (accounts) | 2.69 |
OKX XRP (accounts) | 2.99 |
Binance top traders (accounts) | 3.0016 |
Binance top traders (positions) | 2.0094 |
Top traders hold more long accounts than short ones. Their position size ratio is lower at 2.0094, which means shorts hold bigger positions than their account count suggests.
How Much XRP Was Liquidated in the Last 24 Hours?
About $5.19 million in futures positions were liquidated in 24 hours. Longs lost $3.03 million, and shorts lost $2.16 million.
Shorter windows tell a different story.
Window | Total | Long | Short |
1 hour | $31.66K | $7.43K | $24.24K |
4 hours | $242.80K | $22.68K | $220.12K |
12 hours | $940.00K | $709.18K | $230.82K |
24 hours | $5.19M | $3.03M | $2.16M |
In the last 4 hours, shorts took most of the pain. That fits with the price pushing up a little. Over 12 hours, longs lost more.
What Could Stop the XRP Price Prediction?
A few things could cancel the setup.
Price may fail to close above $1.54 on the hourly chart.
Price could break below the lower triangle line instead.
Futures volume is falling, which can mean weaker momentum.
The wider crypto market could turn down.
Triangle breakouts also fail at times. Traders often call this a fake breakout. Many wait for a close, as Martinez does.
Is XRP Heading to $1.70?
It might. The chart gives a clear trigger and a clear target.
But nothing is confirmed yet. Price still sits under $1.54, and the data shows a mix of long bets and recent liquidations on both sides.
Watch the next hourly closes near $1.54. They will say more than any forecast.
Disclaimer
This article is for information only. It is not financial, investment, or trading advice. Crypto prices are volatile, and you can lose some or all of your money. Price targets are opinions, not guarantees. Do your own research and speak with a licensed financial advisor before you make any decision.
0
0

 Manage all your crypto, NFT and DeFi from one place
Securely connect the portfolio you’re using to start.


