Why Is the Crypto Market Down Today?
5M ago•

bullish:
2
bearish:
2
Share

The Bitcoin (BTC) price and the Crypto Market Cap (TOTALCAP) have fallen sharply since December 9. Curve DAO Token (CRV) could not sustain its increase.
In the news today:
- El Salvador’s Volcano Bitcoin Bonds received regulatory approval from the Digital Assets Commission.
- Five additional U.S. Senators endorsed Elizabeth Warren’s Anti-Money Laundering Act to mitigate crypto’s illicit finance risks.
TOTALCAP Falls After Yearly High
The cryptocurrency market cap has increased rapidly since September. The upward movement culminated with a high of $1.63 trillion on December 9. This was an increase of 65% in the 89 days since the increase began. However, the price fell sharply afterward, accelerating its decrease on December 11.
Market traders use the RSI as a momentum indicator to identify overbought or oversold conditions and to decide whether to accumulate or sell an asset. Readings above 50 and an upward trend indicate that bulls still have an advantage, whereas readings below 50 suggest the opposite.
The decrease was preceded by a bearish divergence (green) in the daily RSI. A bearish divergence occurs when a momentum decrease accompanies a price increase. It often leads to bearish reversals, as was the case with TOTALCAP.
If the decrease continues, TOTALCAP can fall by another 9% to the 0.382 Fib retracement support level at $1.48 trillion.
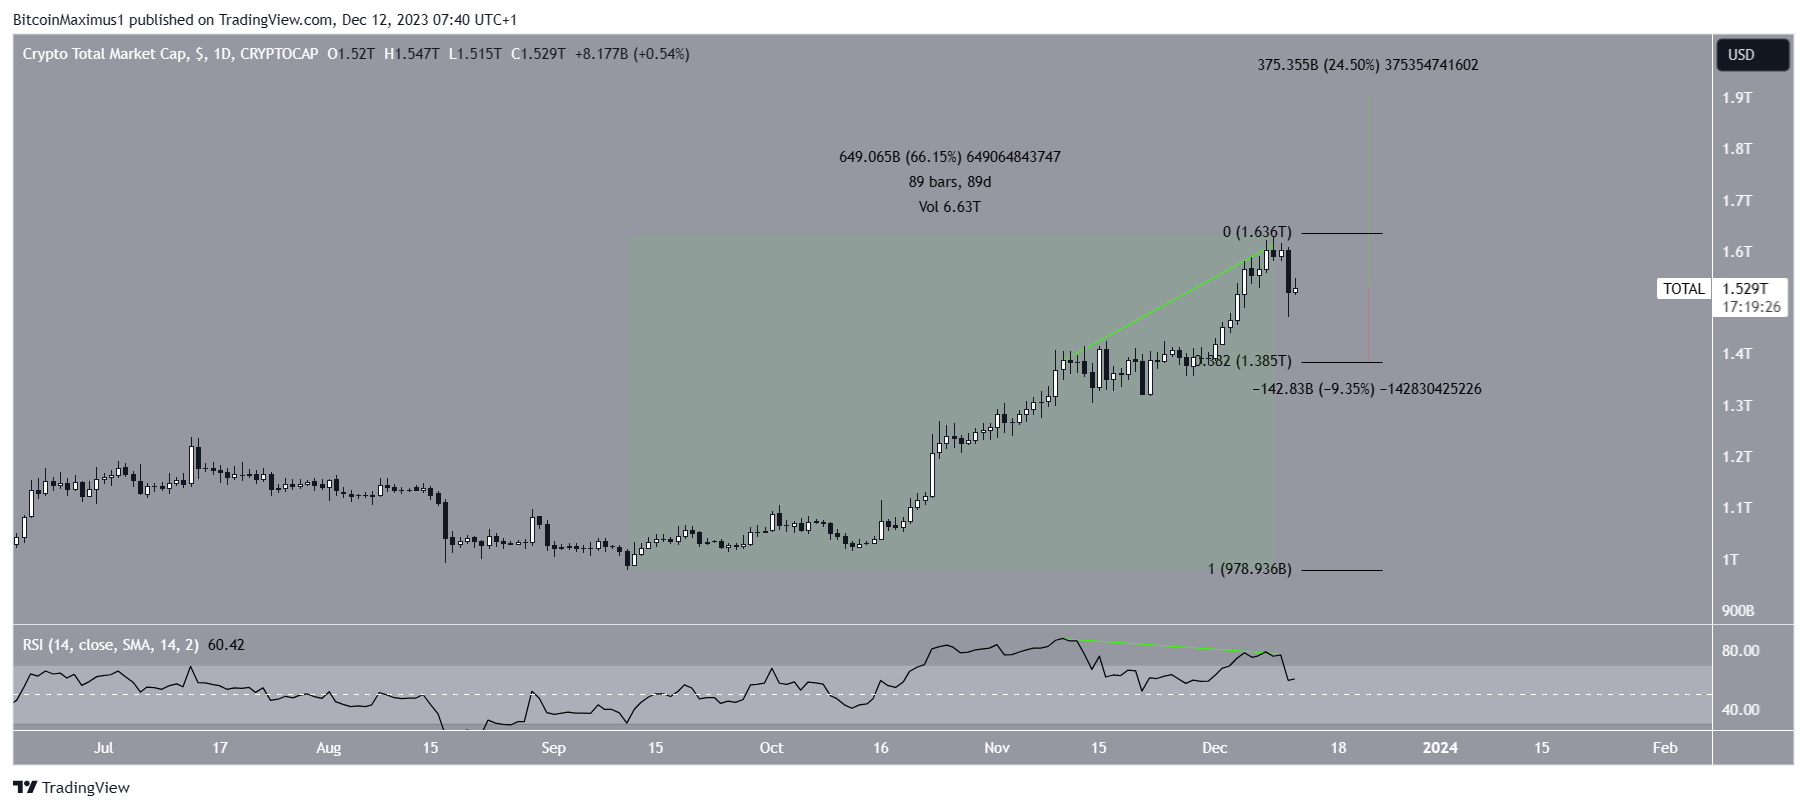 TOTALCAP Daily Chart. Source: TradingView
Despite this bearish TOTALCAP price prediction, a movement above the yearly high of $1.63 trillion will mean the correction is complete. A 25% increase to the next resistance at $1.90 trillion will be likely in that case.
Read More: 9 Best AI Crypto Trading Bots to Maximize Your Profits
Bitcoin Deviates Above Resistance
Similarly to TOTALCAP, the BTC price has increased quickly since September. The increase culminated with a new yearly high of $44,730 on December 8. The price fell afterward, accelerating its decrease on December 11. It is possible that the decrease was caused by over-leveraged futures traders. The entire drop was preceded by a bearish divergence in the daily RSI (green).
An important development in the Bitcoin price is that it deviated above the 0.5 Fib retracement resistance level at $42,450 (red circle). Whether it reclaims this level or resumes its descent will be key in determining the future trend.
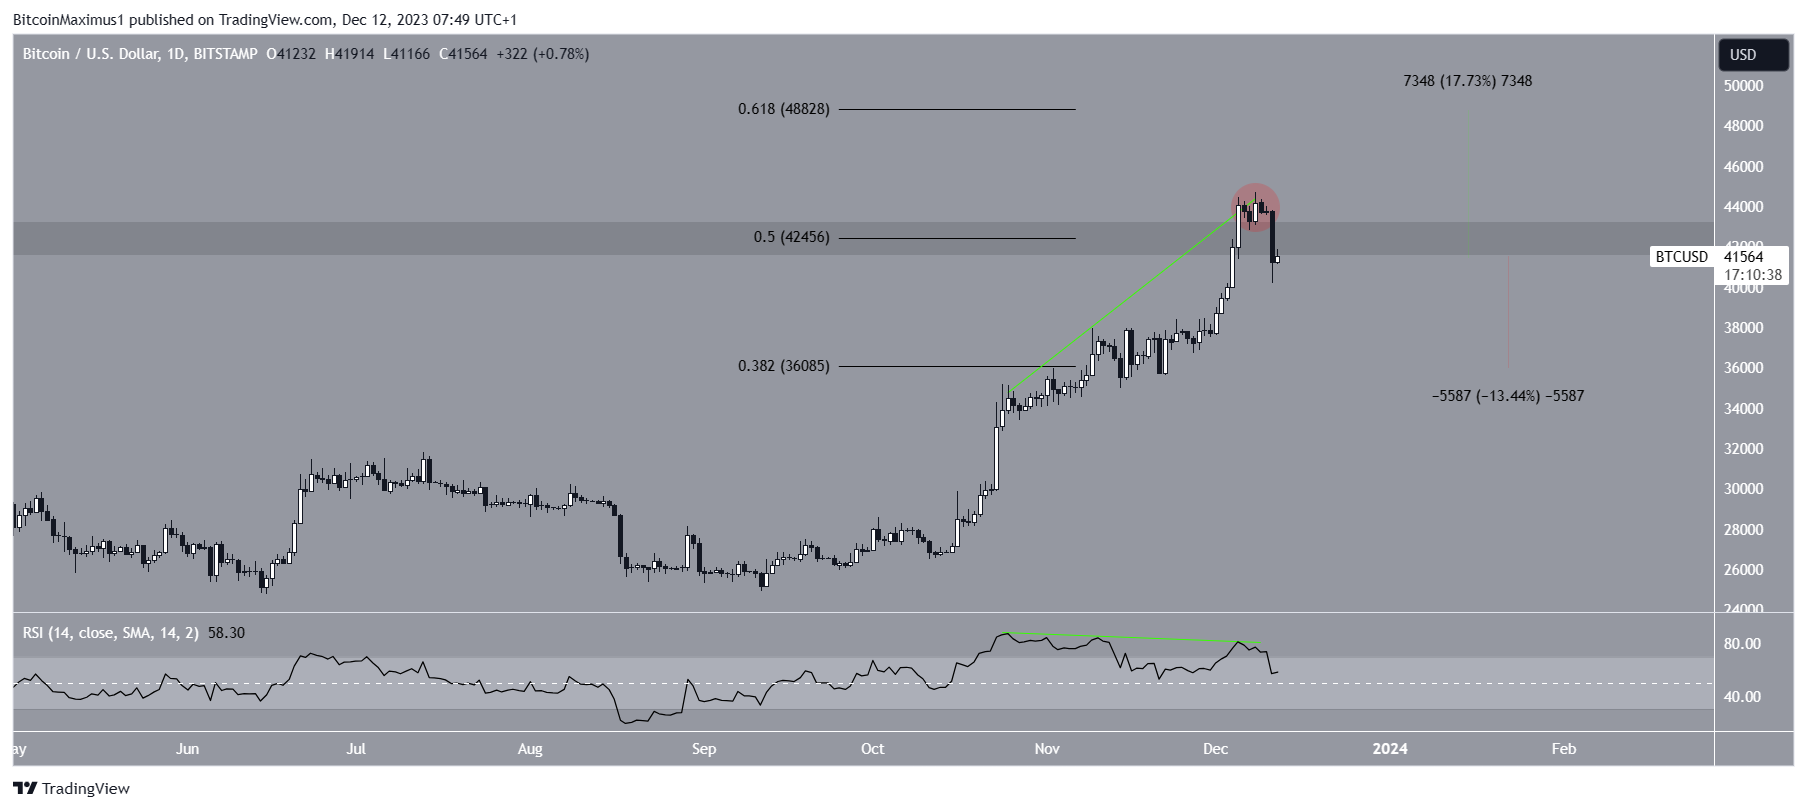 BTC/USD Daily Chart. Source: TradingView
A successful reclaim of the $42,450 level can lead to a 18% BTC price increase to the next resistance at $48,800. On the other hand, a 13% decrease is expected if the BTC price continues falling.
Read More: 9 Best Crypto Demo Accounts For Trading
CRV Falls After Divergence
The CRV price broke out from a descending resistance trend line on November 1. The price created higher highs on November 12 and December 10. However, the most recent high was combined with a bearish divergence in the RSI (green). This led to a sharp decrease yesterday.
If the CRV price continues to fall, it will drop by another 18% to $0.53.
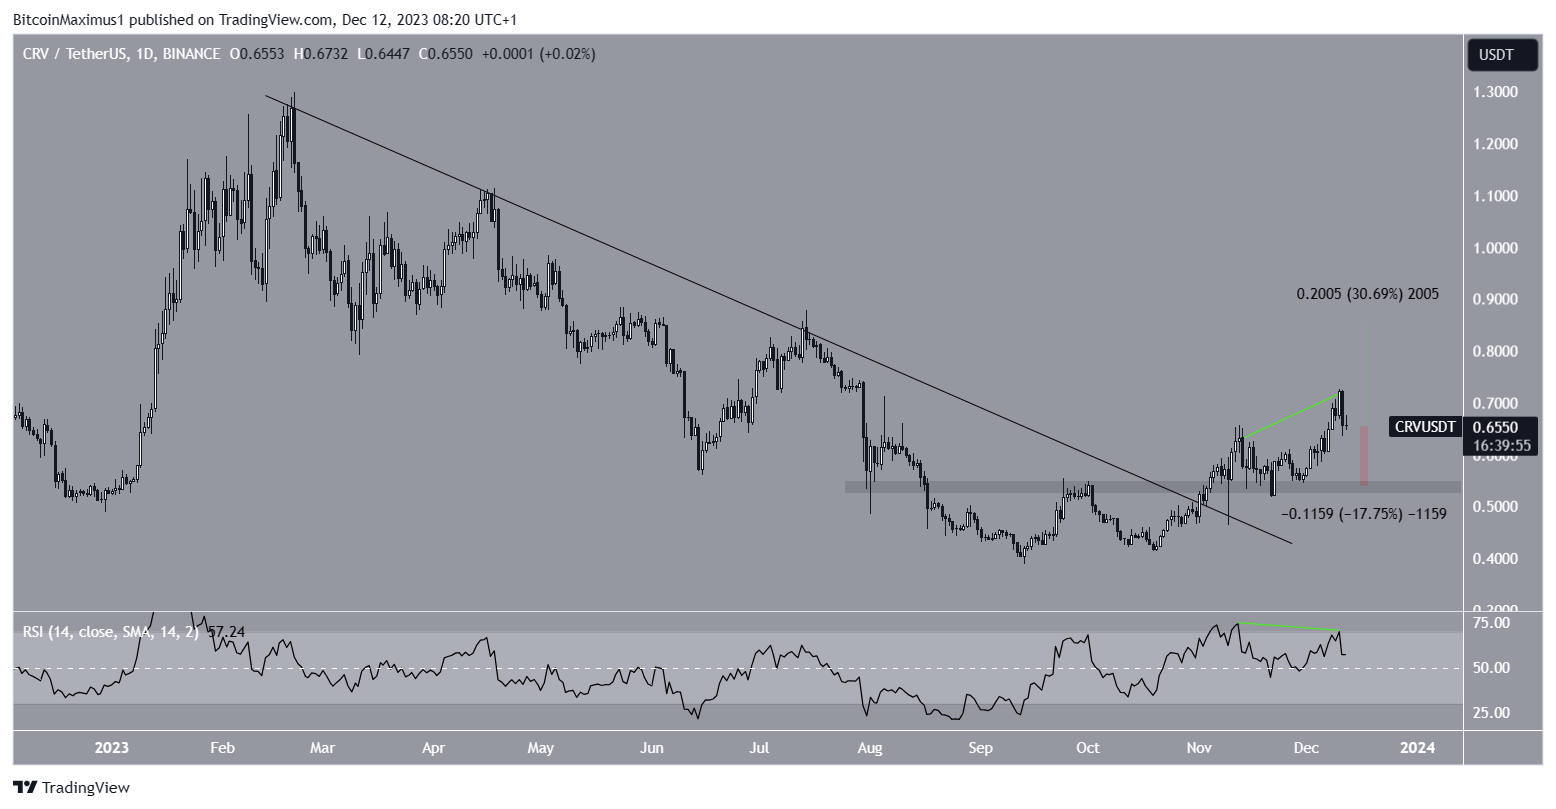 CRV/USDT Daily Chart. Source: TradingView
Despite this bearish CRV price prediction, an increase above the previous high at $0.72 will mean the correction is complete and can lead to a 30% upward movement to $0.85.
For BeInCrypto‘s latest crypto market analysis, click here.
5M ago•
bullish:
2
bearish:
2
Share


 Manage all your crypto, NFT and DeFi from one place
Securely connect the portfolio you’re using to start.

bullish:
0
bearish:
0

bullish:
0
bearish:
0


bullish:
0
bearish:
0