Ripple price today at 1.25 USDT, market in extreme fear and risk of a new drop

0
0
How much is Ripple worth today? The XRP price is at 1.25 USDT in a technical moment that is anything but easy to read. The daily chart paints a clearly bearish picture, but the lower timeframes show a recovery attempt that, for now, remains fragile. The market is not collapsing vertically, but it is not building solid bases for a new upward move either. We are in that gray area where the most common mistake is to overestimate the strength of a bounce that could simply be technical.
The macro context worsens the situation: the total market capitalization of the crypto market has fallen by 3.3% in the last 24 hours and the Fear & Greed index is at 11, in extreme fear territory. Bitcoin dominates 55.9% of the total market, a sign that investors are seeking refuge in what is perceived as the safest asset in the ecosystem. In this scenario, XRP has no room to do anything extraordinary.
The Daily Tells a Bearish Story
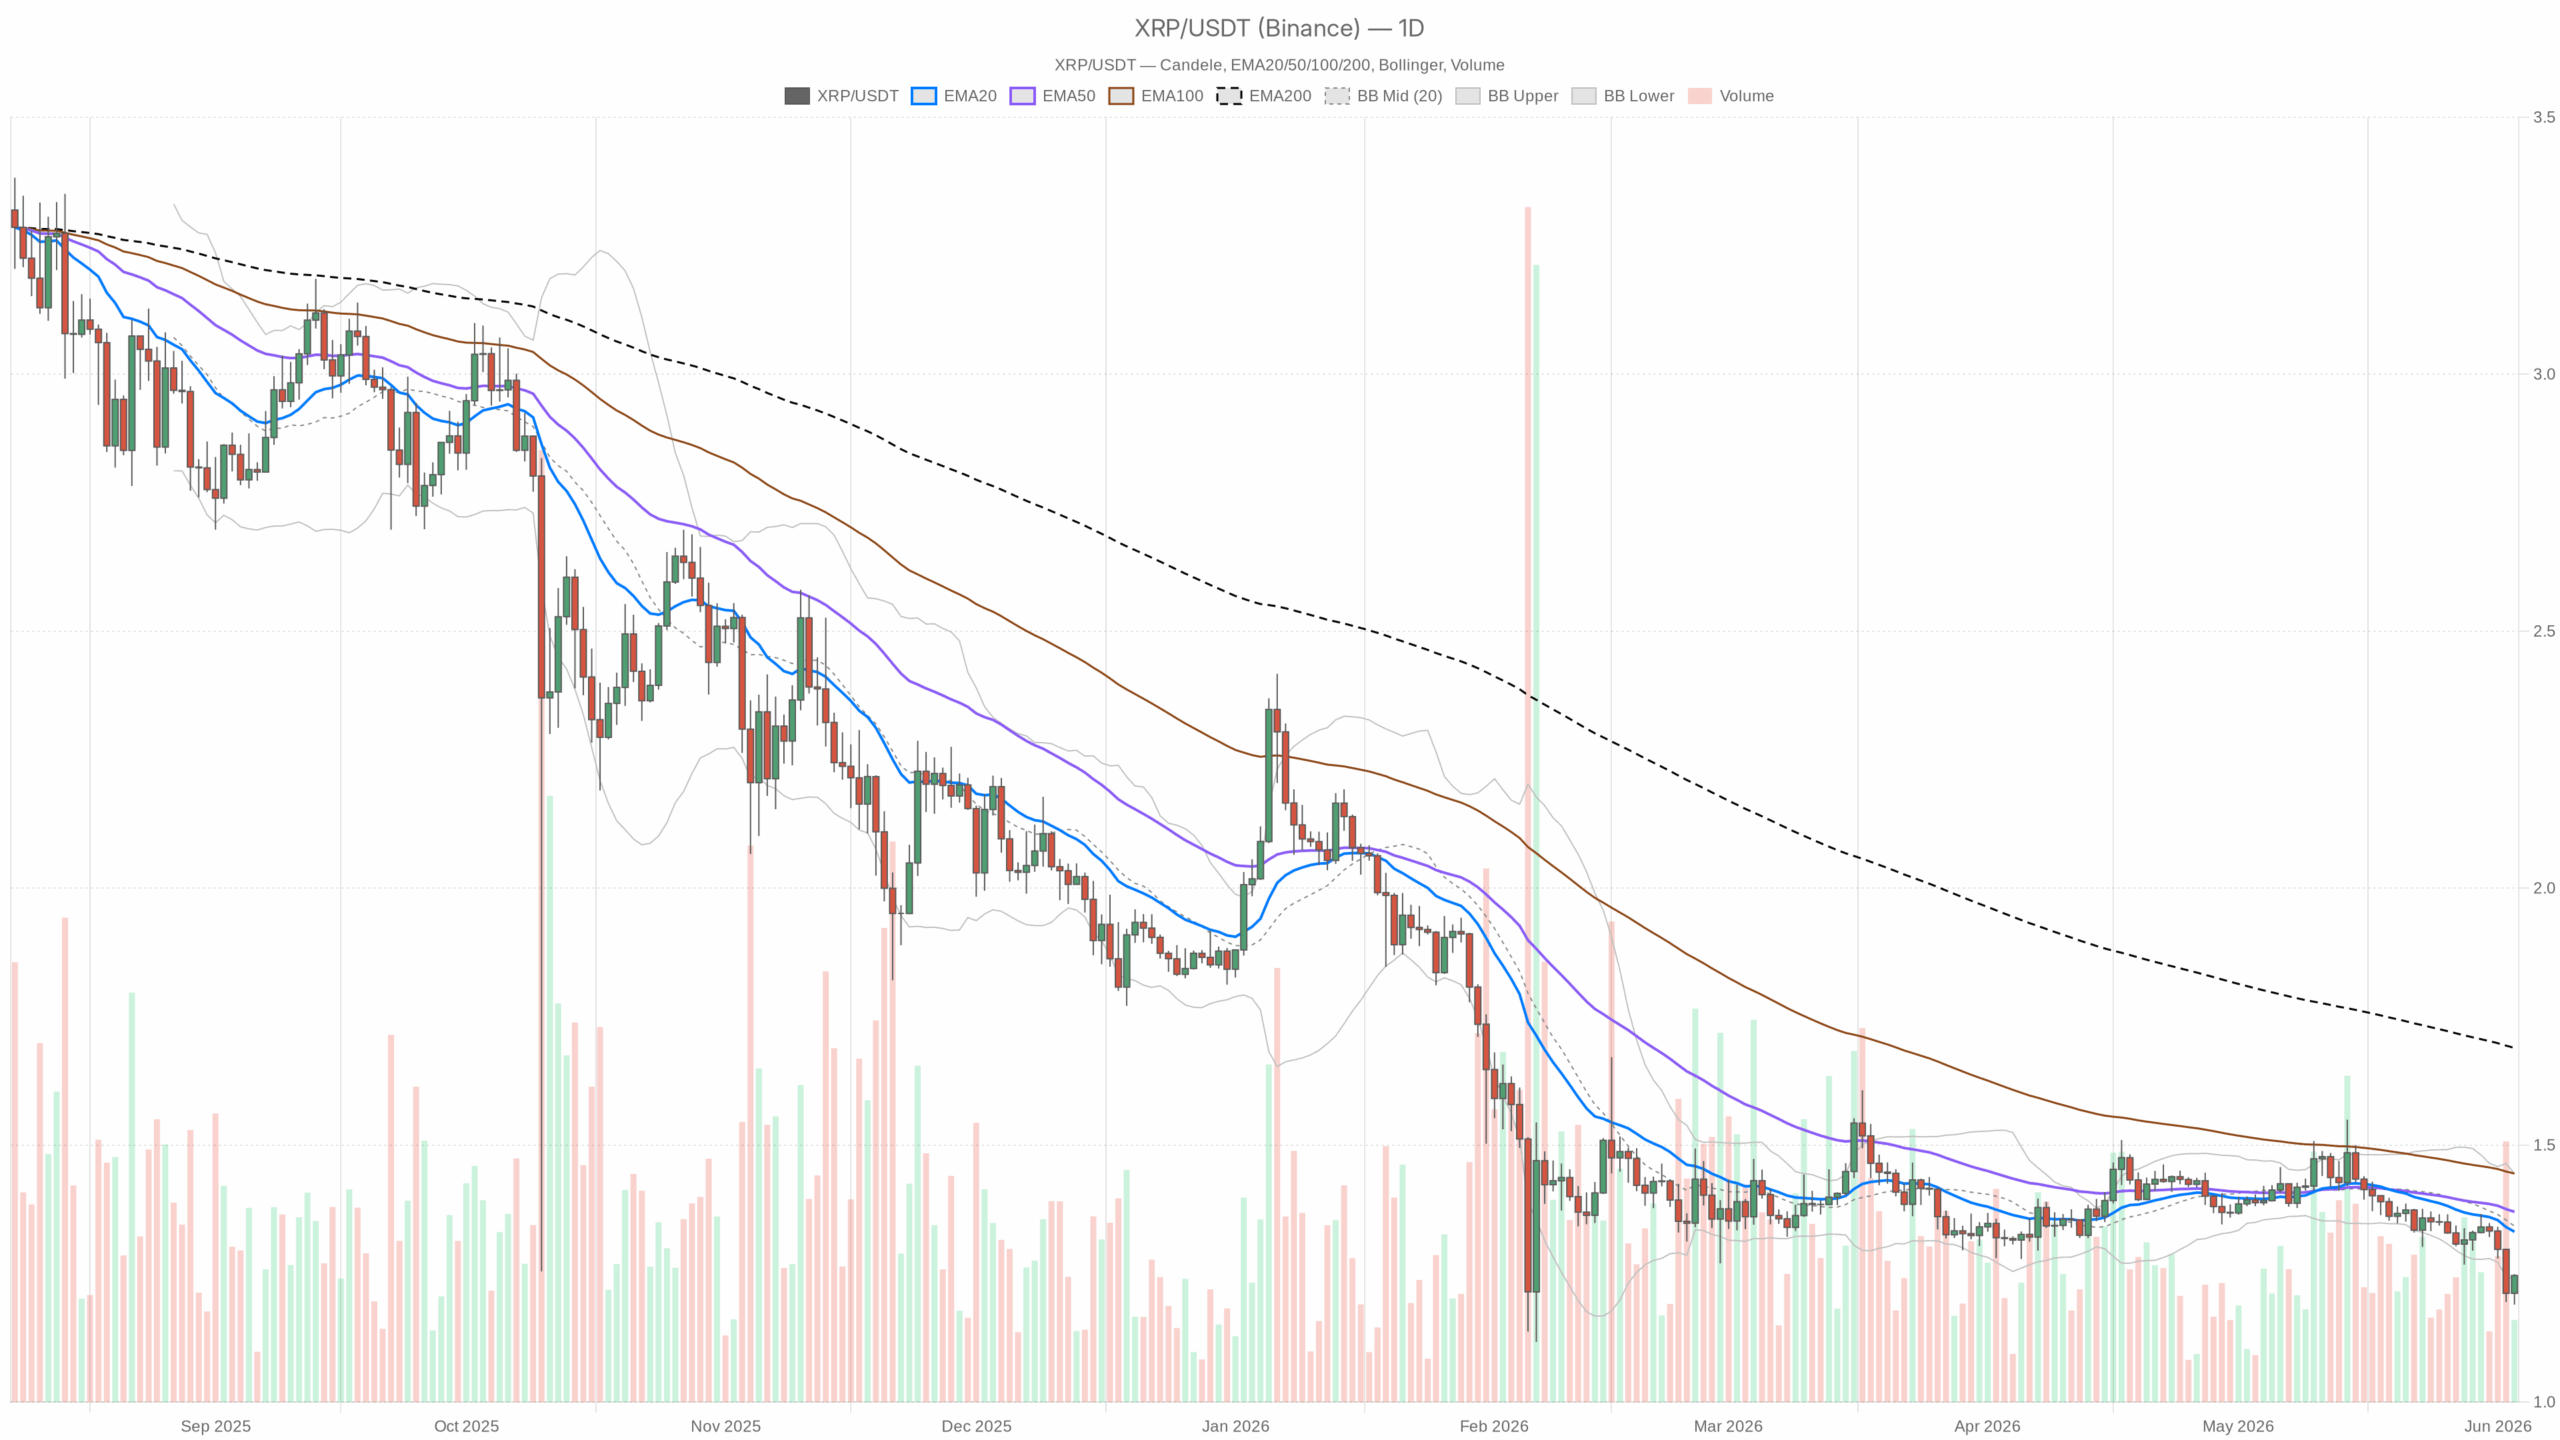
The daily regime is unequivocally bearish. The price at 1.25 USDT is below all three relevant exponential moving averages: EMA20 at 1.33, EMA50 at 1.37 and EMA200 at 1.69. This configuration, in which the price is pressed below a system of EMAs all sloping downward, is the classic signal of a distributive structure that has not yet exhausted its push. There is nothing, on the daily, that suggests an imminent reversal.
The 14‑period RSI on the daily is at 34.37, just above the oversold zone. The number in itself might suggest a contrarian opportunity, but it must be read with caution: an RSI that remains pressed near 30 in a downtrend is not necessarily a buy signal, but often confirms that the weakness is structural and not episodic. The momentum is not exhausted; it is simply slowing down.
The daily MACD confirms this reading without any doubt: line at -0.04, signal at -0.02, histogram at -0.01. The negative and expanding histogram indicates that bearish pressure is still alive, even if it is not accelerating aggressively. There is still no sign of a bullish crossover on the horizon.
The Bollinger Bands on the daily show the price working on the lower band at 1.24, with the upper band at 1.44 and the mid at 1.34. The fact that the price is walking along the lower edge of the bands indicates persistent pressure. This is not a rebound in formation, but a price kept low by distribution. The ATR at 0.05 suggests contained daily volatility, making moves harder to exploit for those seeking quick swings.
The daily pivots place the pivot point at 1.23, R1 at 1.27 and S1 at 1.21. The price at 1.25 is technically above the daily PP, but the distance from R1 is minimal, only 2 cents, which means that the margin for a test of resistance is tight and any failure could bring the price back toward S1.
In the Short Term Something Is Moving
Moving to the hourly, the picture partially changes. The H1 regime is neutral, with the price at 1.25 above both EMA20 (1.23) and EMA50 (1.26 — practically in line with the current price). The only relevant technical obstacle is the hourly EMA200 at 1.31, a true dynamic resistance to watch in order to understand whether this recovery has legs.
The hourly RSI at 52.73 is in the neutral zone, neither overbought nor oversold. It does not indicate strength, but neither does it indicate extreme weakness: it is the typical reading of a sideways consolidation or a controlled bounce. The H1 MACD shows a slightly positive histogram at +0.01, with the line rising above the signal: it is an initial sign of momentum recovery, but so small that it is not yet reliable.
On the 15‑minute chart, the regime is also neutral, but the RSI at 66.15 indicates that the short‑term move is becoming overheated. The price has already run in recent hours and is approaching the upper Bollinger Band at 1.26. The M15 MACD is just above zero, a sign of positive but exhausted momentum. Those looking for a short‑term long entry should consider that the train may already have left.
Bullish Scenario: what would be needed to shift gears
To build a credible bullish case, the price would need to consolidate above 1.26-1.27, corresponding to the confluence between the upper H1 Bollinger Band, the daily R1 and the hourly EMA50. A convincing H1 close above this level would open the way toward 1.31, where the hourly EMA200 is located, the real test of strength.
If XRP were to break above 1.31 with volume and without an immediate retracement, the setup would be interesting even for swing traders with a multi‑day outlook. The next target would be the 1.34-1.37 area, a zone dense with dynamic resistances (daily EMA20 and EMA50).
Invalidation level: an H4 close below 1.21 (daily S1) would turn the bullish scenario into a false signal, opening the door toward the 1.15-1.18 area.
Bearish Scenario: the structure that does not convince
The bearish scenario is currently the most consistent with the context. The daily is in a negative trend, the EMAs are all above the price and sloping downward, and the MACD does not show significant positive divergences. The recent short‑term recovery looks like a technical bounce in the downtrend, a typical move that tries to suck in buyers before a new drop.
If the price does not hold 1.24-1.25 in the coming hours, the drop toward 1.21 (daily S1) becomes the default scenario. Below 1.21, there is little structural support until the 1.15 area, which coincides with the widened lower daily Bollinger Band.
Invalidation level: a daily close above 1.33 (daily EMA20) with RSI above 40 would call the current bearish trend into question.
How to read this moment
The context is that of an asset in a daily downtrend executing a technical bounce on lower timeframes, in a risk‑off market. The extreme fear recorded by the Fear & Greed index at 11 indicates capitulative sentiment, potentially a cause of violent bounces but not necessarily of trend reversals.
The main risk for those operating long is the false breakout: XRP could briefly break 1.26-1.27 only to fall back below 1.24 within a few hourly candles, a typical trap in conditions of weakness. Those who want to position themselves to the upside should wait for solid confirmations on the daily, not act on a simple 15‑minute bounce with RSI already at 66.
For bears, the delicate point is not to chase short positions near the short‑term support at 1.24. The risk of a squeeze remains high in an asset with compressed volatility as indicated by the daily ATR at 0.05.
The Ripple price today reflects an undecided market, but the underlying structure still favors the bears.
0
0

 Manage all your crypto, NFT and DeFi from one place
Securely connect the portfolio you’re using to start.

0
0

0
0

0
0
