
Hyperliquid Price Prediction Today: Key Breakout Levels for HYPE

0
0

Hyperliquid price prediction is in focus again as HYPE grinds lower into a tightening pattern, with buyers and sellers now squeezed into a narrow pocket that rarely stays quiet for long.
A large whale has been quietly staking its size even as the wider tape stays cautious, setting up an interesting tug of war right at current levels.
Quick Take: HYPE is trading near $57.147. This is a short-term read based on the 1-hour chart and should be rechecked if the price closes decisively beyond either $58.179 or $56.466.
Quick Take: HYPE trades near a critical decision zone around $57.12, with a confirmed hourly close above $59.43 signaling a bullish breakout, while a close below $56.46 could expose $55.48.
$HYPE Price Right Now
Metric | Value |
Price | $57.127 |
24h Change | -1.65% (-$1.7978) |
Market Cap | $14.44B |
Futures Volume (24h) | $1.56B |
Spot Volume (24h) | $82.93M |
Open Interest | $2.42B |
Circulating Supply | 252.70M HYPE |
Total Supply | 953.06M HYPE |
Max Supply | 953.06M HYPE |
The price is taken from the live TradingView chart, with volume, market cap, open interest, and supply figures from Hyperliquid data on CoinGlass, as of July 25, 2026, around 2:15 PM IST.
Methodology And Data Sources
This $HYPE technical analysis uses the 1-hour HYPE/USDT chart on Binance via TradingView for price structure, with volume, open interest, and market cap figures from CoinGlass and liquidation flow from CoinGlass's HYPE liquidation tracker.
All levels are treated as invalidated only on a confirmed 1-hour candle close beyond the stated trigger, not an intraday wick.
Why Is HYPE Falling Today
Spot Hyperliquid ETF products recorded net outflows of approximately $6.89 million on July 24. 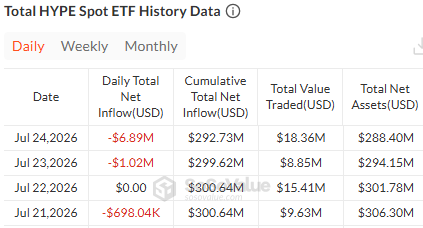
Daily data shows outflows of roughly $6.89M on July 24, $1.02M on July 23, and $698.04K on July 21, with cumulative net inflows sliding from $300.64M down to $292.63M and total net assets dropping from $306.30M to $288.40M over the same stretch.
As per the BSCN recent whale accumulation update, According to Lookonchain, 19 wallets likely controlled by the same entity staked approximately 2.93 million HYPE worth nearly $172 million.
That mismatch between one large holder buying and the broader product seeing redemptions is adding to the uncertainty.
Additionally, Bitcoin has been soft in recent sessions too, and that kind of market-wide caution tends to bleed into altcoins like HYPE regardless of what any single wallet is doing.
The full ETF flow history is available on HYPE spot ETF tracking.
ETF outflows generally indicate reduced institutional demand, while whale staking reduces circulating supply. These opposing forces create uncertainty, making technical levels especially important.
$HYPE Liquidation Data Today
Liquidation flow over the past day leans heavily toward longs, showing leveraged buyers have been caught out repeatedly as the price slides.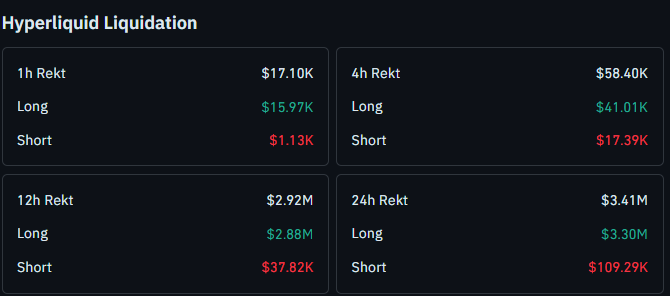
Over the past hour, $17.10K was liquidated, split between $15.97K in longs and $1.13K in shorts. The 4-hour figure comes in at $58.40K, with $41.01K from longs and $17.39K from shorts.
The wider windows show the same tilt at a much bigger scale. Over 12 hours, total liquidations reach $2.92M, made up of $2.88M in longs against just $37.82K in shorts.
Across the full 24 hours, liquidations hit $3.41M, and longs account for $3.30M of that, while shorts make up only $109.29K.
That consistent long-side skew across every window points to a market that kept attempting to accumulate near support. on the way down, only to get flushed out again and again. The complete breakdown sits on the HYPE liquidation tracker.
$HYPE Technical Analysis: 1-Hour Chart Breakdown
HYPE has been sliding inside a falling wedge since July 22, with price respecting both boundaries of the pattern as it compresses lower.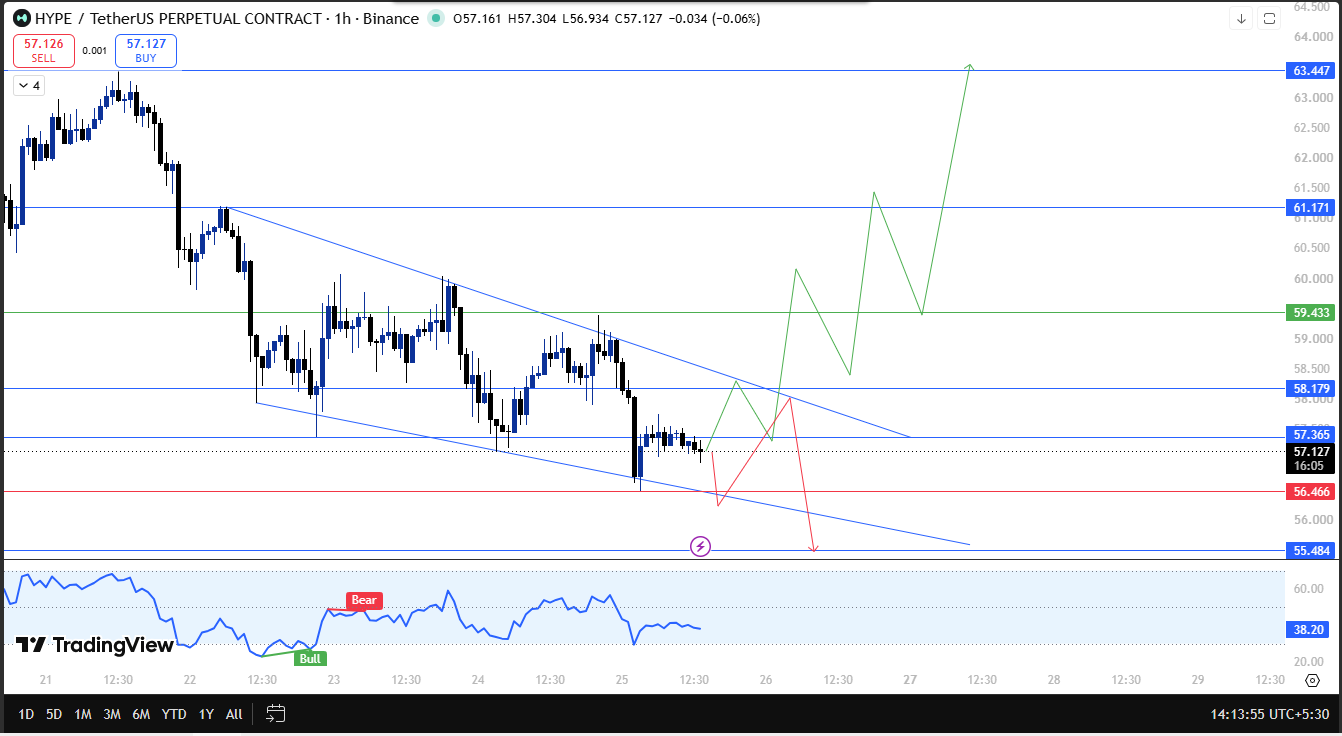
That kind of structure after a sustained slide often signals sellers are losing steam even while price keeps drifting down, a setup we flagged early in our pennant breakout coverage.
Price is still trading inside the wedge right now, holding between the $57.365 and $56.466 support bands without a decisive break in either direction yet.
RSI cooling off after an earlier bearish reading also fits a market that is losing downside momentum rather than accelerating it, a dynamic covered in our sellers losing control analysis.
If HYPE breaks $56.466 and a 1-hour candle closes below it, that invalidates the bullish scenario and opens $55.484 as the next support.
If instead the price breaks above $59.433 and closes an hourly candle above it, that confirms a key support defense turned breakout, opening the path toward $61.171 and then $63.447.
HYPE Glossary
Falling Wedge: A bullish chart pattern formed by two downward-sloping converging trendlines. It often signals weakening selling pressure and a potential upside breakout after confirmation.
Liquidation: What happens when a leveraged trade gets forcibly closed because the trader ran out of margin to keep it open.
Spot ETF Outflow: Net money leaving an exchange-traded fund, often used as a signal of cooling institutional demand.
Open Interest: The total value of outstanding derivative contracts, used to gauge how much leverage is active in a market.
HYPE Technical Snapshot
Indicator | Signal |
Trend | Falling wedge, price still trading inside the pattern |
Structure | Holding between $57.365 and $56.466, no decisive break yet |
Liquidations | Long liquidations dominate every window over the past 24 hours |
Key Trigger | 1h close below $56.466 invalidates; close above $59.433 confirms breakout |
Broader Catalyst | ETF outflows and BTC softness weighing despite whale accumulation |
For a closer look at how the pattern narrowed into this point, our support test amid whale selloff chatter tracks the same compression.
HYPE Support And Resistance Levels To Watch
Type | Level | Note |
Resistance 3 | $63.447 | Extended upside target |
Resistance 2 | $61.171 | Next hurdle after a confirmed breakout |
Resistance 1 | $59.433 | Breakout trigger on a 1-h closing basis |
Current Price | $57.127 | Trading inside the falling wedge |
Support 1 | $56.466 | Invalidation trigger on a confirmed close below |
Support 2 | $55.484 | Next support if $56.466 breaks |
Risk-Reward Table
Case | Trigger | Target |
Bull Case | 1h close above $59.433 | Move toward $61.171, then $63.447 |
Bear Case | 1h close below $56.466 | Slide toward $55.484 |
Invalidation Level
The bullish falling wedge setup for HYPE stays alive as long as price holds above $56.466 on a 1-hour closing basis.
A confirmed close below that level invalidates the setup and shifts focus toward $55.484.
On the other side, a 1-hour close above $59.433 would confirm the wedge is breaking out to the upside, supporting a move toward $61.171 and then $63.447, a scenario our pullback and breakdown levels piece also outlines from the bearish side.
CoinGabbar's Technical Analyst View
HYPE remains inside a falling wedge, a structure that often favors buyers once broken. A 1-hour close below $56.466 invalidates this and opens $55.484. A close above $59.433 confirms the wedge breakout, targeting $61.171 and $63.447 next.
Disclaimer: This technical analysis is for educational purposes only and should not be considered financial or investment advice. Cryptocurrency markets are highly volatile.
0
0

 Manage all your crypto, NFT and DeFi from one place
Securely connect the portfolio you’re using to start.

0
0

0
0

0
0

0
0