
Shiba Inu Price Prediction: $SHIB Is One Step Away From Exploding

0
0

This shiba inu price prediction opens with today's number: SHIB is down 1.4%, sitting at $0.000004182.
That's roughly 95% below its all-time high of $0.00008845, set back in October 2021 during the same meme-coin frenzy that carried Dogecoin to its own peak.
$SHIB and DOGE still get lumped together in every "meme coin" conversation, both massive-supply and both community-driven.
Though $SHIB leaned harder into token burns and its Shibarium ecosystem while DOGE rode the Musk-era hype cycle further.
Where SHIB goes next comes down to a pattern forming on both the daily and 4-hour charts right now, plus a wallet concentration number worth knowing either way. Both are covered below.
SHIB Price Snapshot (July 24, 2026)
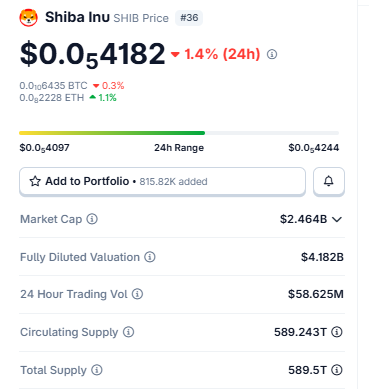
Source: Data Taken From Coingecko, data as of July 24, 2026. Figures may vary slightly across other tracking websites.
Supply sits in the trillions here, which is exactly why price moves in tiny decimals a shift from $0.000004182 to $0.000004444 looks small on screen but represents a real, meaningful percentage move once the scale is accounted for.
Liquidation Data: Whipsawed, Not One-Sided
The dollar amounts here are small, but the pattern's worth a look. Over the last hour, $197.92 got liquidated every cent of it from shorts, zero from longs.
The 4-hour window shows the same thing: $199.59 total, entirely shorts again, lining up with $SHIB grinding sideways-to-up and squeezing anyone leaning against it. 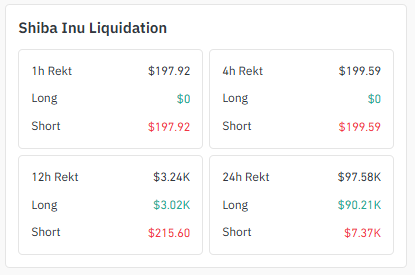
Source: Liquidation Data Taken From Coinglass, at 24-07-2026
Zoom out to 12 hours, though, and it flips $3.24K liquidated, with $3.02K of that coming from longs and just $215.60 from shorts, pointing to a sharper move earlier that caught over-leveraged bulls off guard.
Over the full 24 hours, the total sits at $97.58K, split $90.21K long versus $7.37K short, so the bigger picture still favors longs eating the pain even as the last couple hours swung the other way.
Reads like a session that hit both sides at different points rather than one clean squeeze.
Exchange Volume and Holder Concentration
Exchange volume on SHIB doesn't pile onto one giant venue; it's spread thin across a handful of mid-tier exchanges instead.
LBank leads at $14.65M, OKX follows at $10.27M, then MEXC at $6.10M, with Bitget, Bitunix, and Kraken trailing behind in that order. 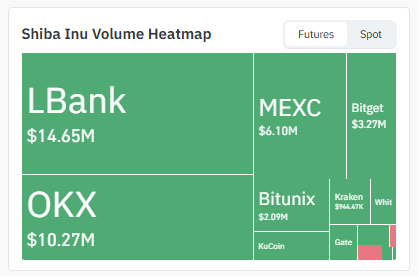
Source: Volume Heatmap Data Taken From Coinglass, at 24-07-2026
Thinner and more fragmented than what majors like DOGE or UNI show, which usually means sharper swings depending on which exchange's order flow is driving things at any given moment.
Holder concentration is where things get genuinely extreme, though. The top 100 wallets hold 83.16% of the total supply.
Go further, and whale concentration hits 94.47% of market cap from wallets that make up just 0.04% of all holders. 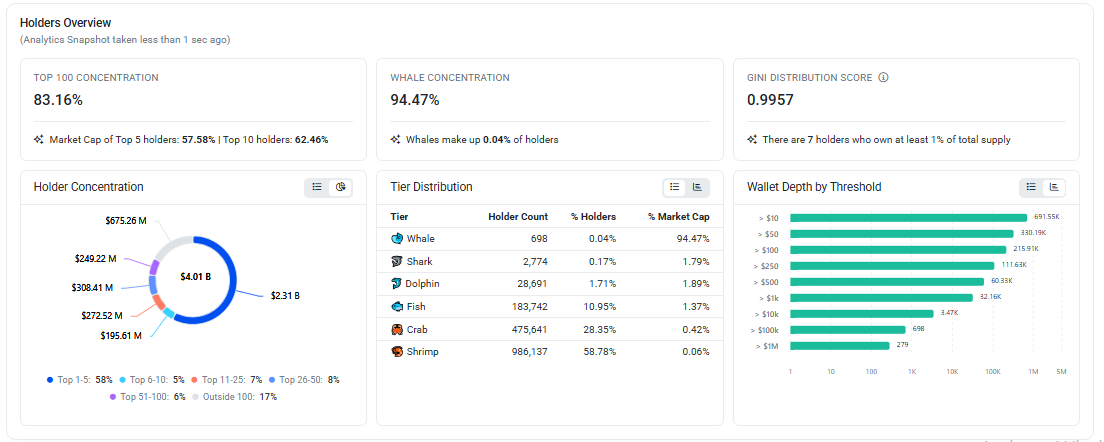
Source: Holder Data Taken From Etherscan on 24-07-2026
Gini score: 0.9957. Five wallets alone account for 57.58% of market cap, and seven separate addresses individually own at least 1% of total supply.
On the other end, 986,137 shrimp-tier wallets, by far the biggest group by headcount, hold just 0.06% between them.
None of this predicts direction by itself, but a handful of large wallets moving could shift price faster than any chart pattern.
4-Hour Chart: Descending Channel Sitting at Its Edge
SHIB closed the 4H candle flat at $0.00000419, ranging between $0.00000417 and $0.00000420.
Price is riding inside a clearly marked descending channel, both boundaries sloping down in parallel, and it's sitting right where the channel's lower edge meets recent support.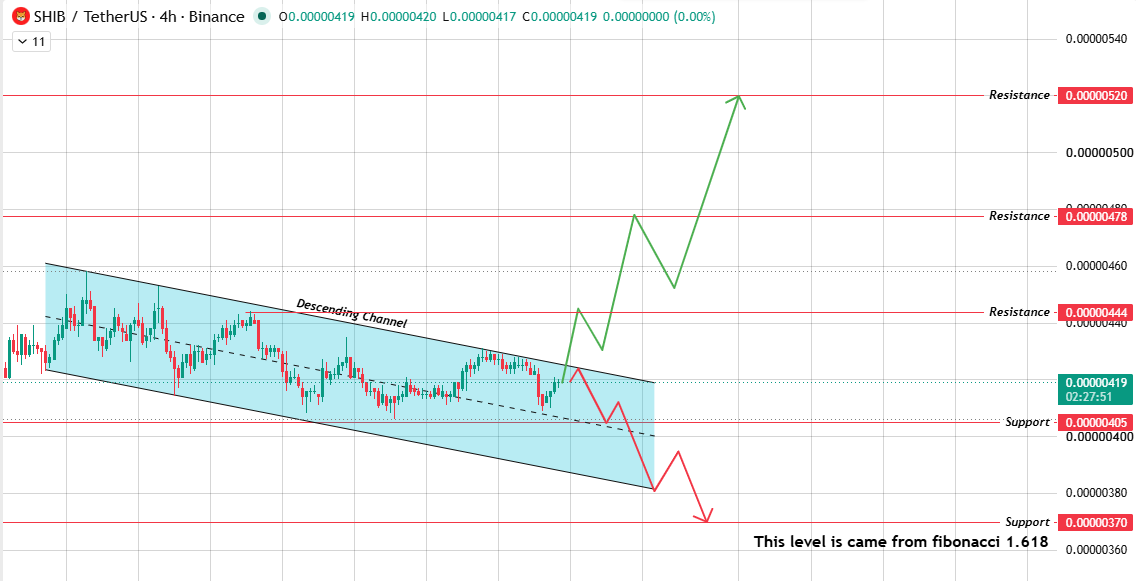
Source: Chart Taken From TradingView, 24-07-2026
Break the ceiling, and resistance stacks at $0.00000444, then $0.00000478, then $0.00000520 if momentum carries.
Break down instead, and support sits at $0.00000405, with $0.00000370 as the deeper floor the same Fibonacci level the daily chart flags, which is a good sign the two timeframes agree rather than contradict each other.
1-Day Chart: Descending Triangle, Wolfe Wave Leaning Up
The daily candle closed at $0.00000418, up 0.97%, running from a low of $0.00000410 to a high of $0.00000421.
The structure here is a descending triangle.
Swing points 1 through 5 trace it out, with a flattening support line underneath and a downward-sloping resistance line squeezing in from above.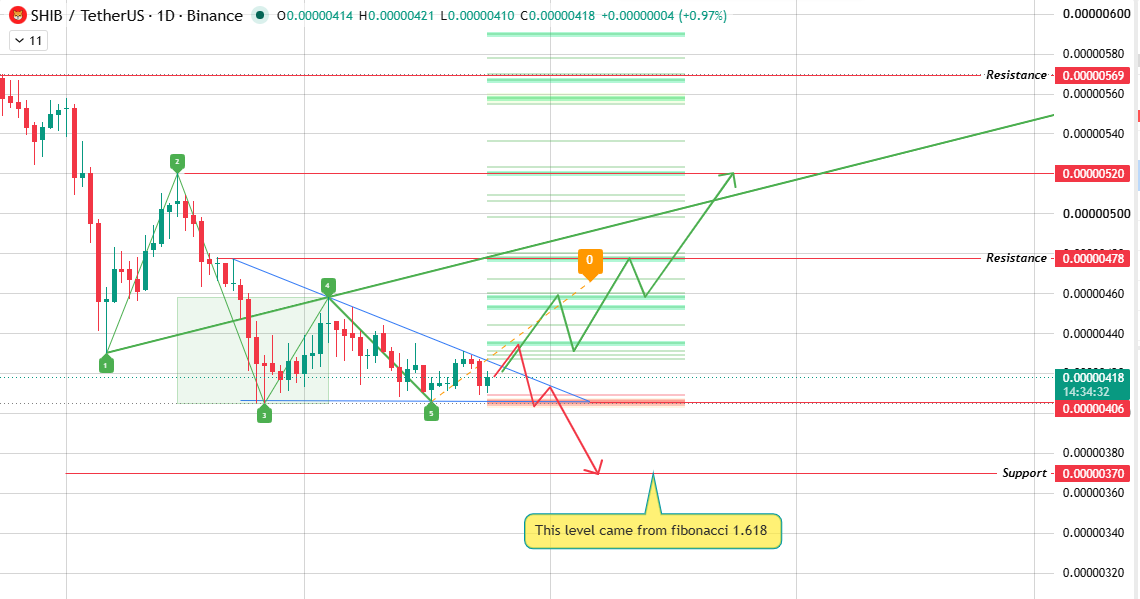
Source: Chart Taken From TradingView, 24-07-2026
Worth flagging: the chart's Wolfe Wave marking leans bullish on this one, pointing toward the upside if the triangle's upper boundary breaks.
Clear it, and $0.00000478 is first up, with $0.00000520 and $0.00000569 further out if buyers keep showing up.
That the bullish breakout case is not guaranteed, but it's what the Wolfe Wave structure is favoring right now.
Flip side: if the lower boundary gives way instead, the chart points to $0.00000406 first, then down to $0.00000370 a level marked directly on the chart as coming from the Fibonacci 1.618 extension.
Clean downside target, no guesswork involved.
SHIB Scenario Table
BTC Dominance and ETH Correlation
SHIB runs on Ethereum, so its ETH correlation matters more than people usually credit. Ethereum's own trend and gas-fee environment both bleed into how SHIB trades.
Broader BTC dominance shifts play a role too: $SHIB tends to get squeezed out of favor when capital rotates hard into Bitcoin and comes back to life when risk appetite spreads into smaller-cap altcoins.
Final Outlook
Both timeframes are telling a consistent story here, rather than Bitcoin and different directions.
The daily's descending triangle has a Wolfe Wave leaning bullish, and the 4H descending channel mirrors that setup at a shorter scale.
Break the upper boundaries on both, and $0.00000444 through $0.00000478 is the realistic near-term move, with $0.00000520–$0.00000569 further out.
Lose support instead, and $0.00000370 is the level both charts agree on not a guess, it's baked into the chart structure itself via the Fibonacci extension.
The wallet concentration is the wildcard sitting on top oon, nothis guess;r half a percent of holders control over 90% of market cap, and any real move from a handful of those wallets could overtake whatever the triangle and channel are doing on their own.
Glossary
-
Descending Triangle: A flattening support line underneath and a downward-sloping resistance line above price squeeze into a narrower range until one side gives way.
-
Descending Channel: Two parallel, falling lines that price bounce between until it breaks out of either edge.
-
Wolfe Wave: A five-point structure traders use to project where price is likely headed, based on the shape of prior swings.
Methodology
Every level here triangle boundaries, channel edges, support and resistance came directly off the SHIB/USDT 1D and 4H charts on Binance, reviewed July 24, 2026.
Liquidation and exchange volume figures match that window. Holder data reflects an on-chain snapshot from the same time.
Nothing here goes beyond what the source charts and data actually show.
This is not financial advice. SHIB is volatile, and these levels can shift quickly
Disclaimer: This article is for informational purposes only and is not financial advice. Cryptocurrency markets are volatile; do your own research before investing..
0
0


 Manage all your crypto, NFT and DeFi from one place
Securely connect the portfolio you’re using to start.


0
0

0
0

0
0