
Cosmos Price Prediction August 2026: $ATOM Eyes Explosive Breakout

0
0

Cosmos is one of the leading blockchain ecosystems focused on connecting independent networks through its Inter-Blockchain Communication (IBC) protocol.
As of now, ATOM is trading around $1.25, making this Cosmos Price Prediction August 2026 a closer look at whether the project can build enough momentum for its next major move.
$Cosmos Price Today: Live Data and 24-Hour Change
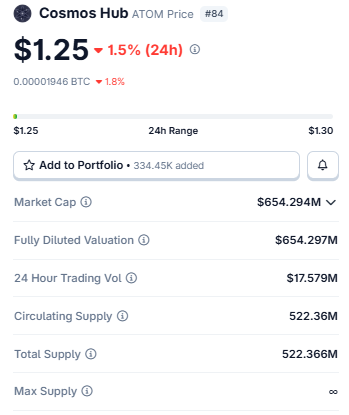
Source: $ATOM Market Cap Data Taken From Coingecko, data as of July 31, 2026. Figures may vary slightly across other tracking websites.
ATOM has slipped roughly 2% on the day, near 10% over the week.
This $Cosmos price analysis puts the $ATOM valuation at a level that hasn't been held for long recently, and that $ATOM price movement is why this Cosmos forecast for August 2026 matters more than usual.
Technical Analysis: Key Support and Resistance Levels
Daily Chart Analysis for Cosmos Price Prediction August 2026
The daily chart shows $ATOM grinding lower for weeks inside a falling wedge, with the price now sitting right at the tip where the lower boundary line converge, a classic squeeze point. 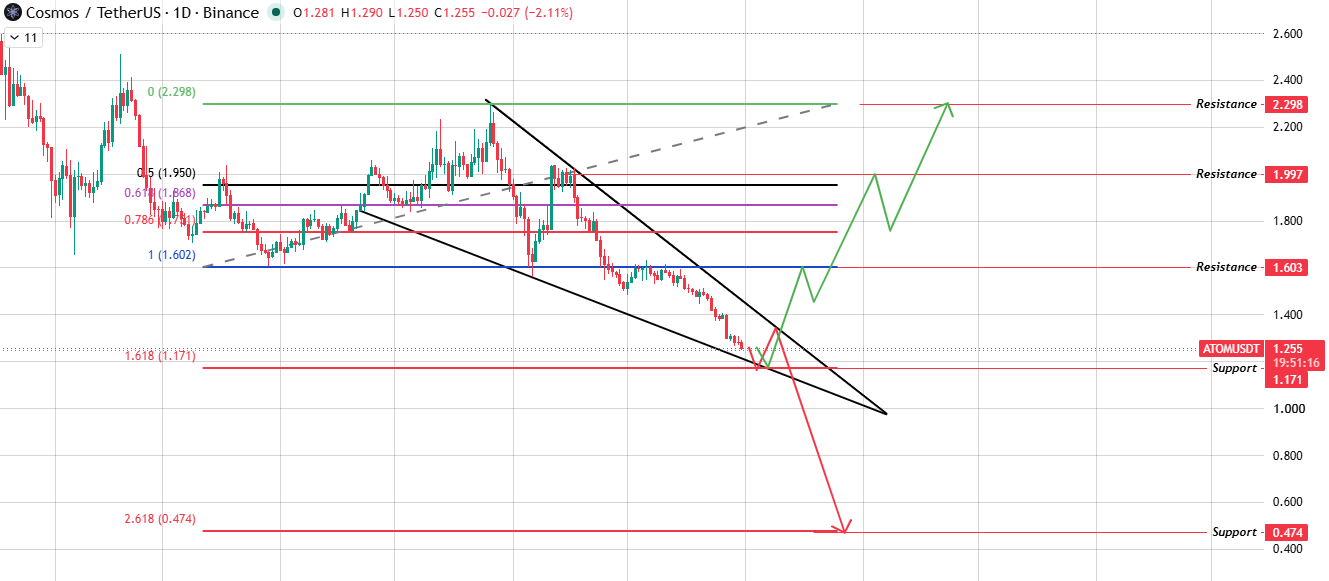
Source: Chart Taken From TradingView.
A breakout above points toward resistance at $1.60, then $1.99, then $2.30.
A breakdown instead opens Fibonacci supports at $1.17 first, then $0.47.
$Cosmos Weekly Chart Analysis
On the weekly chart, $ATOM sits against the lower boundary of a longer descending channel from many past months.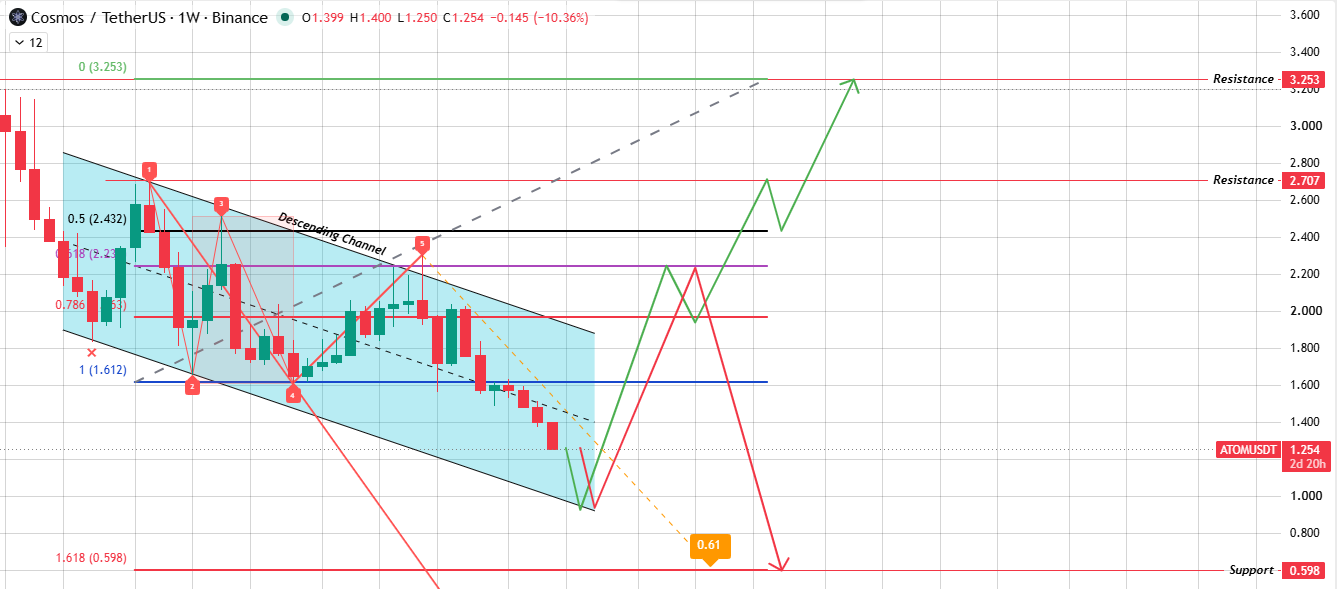
Source: Chart Taken From TradingView.
A volume-backed breakout from the channel opens a path toward $2.71 and $3.25.
If that fails and the lower boundary breaks on volume, the Wolfe Wave structure points to the same $0.60 level.
This $Cosmos technical analysis and ATOM price outlook both agree on the same zone, making this Cosmos price prediction august 2026 worth watching closely.
Cosmos Price Prediction August 2026: Bull, Base, and Bear Cases
| Scenario | Daily Target | Weekly Target | Trigger | Invalidation |
|---|---|---|---|---|
| Bull | $1.60 – $2.30 | $2.71 – $3.25 | Break and hold above $1.60 with rising volume. | Rejection at $1.60; price falls back inside the range. |
| Base | $1.17 – $1.60 | Range-bound | Price continues trading inside the channel. | Decisive close outside either boundary. |
| Bear | $0.47 – $1.17 | $0.60 | Break and hold below $1.17. | Reclaiming $1.17 invalidates the bearish outlook. |
Every level in this $Cosmos price target 2026 table comes straight off the chart.
The daily column drives our atom outlook for August, while the weekly column shows where each scenario could stretch to if the move carries past this month.
The base case leads for now, keeping Cosmos next target levels above $2.30 off the table until the price earns them.
Key Takeaways
-
ATOM trades near $1.25, sitting right at a make-or-break zone after weeks of steady selling
-
This Cosmos price prediction August 2026 sees a near-term range between $1.17 and $1.60.
-
A clean move above $1.60 opens the door toward $1.99 and $2.30, the first real bullish signal for this ATOM price prediction
-
Losing $1.17 risks a slide toward $0.47, the next major floor
-
This atom forecast August 2026 sees a weekly channel breakout eventually opening a path to $2.71 and $3.25.
Holder Concentration and On-Chain Signals
ATOM's holder base stays concentrated among long-term stakers and validators, limiting sudden supply shocks while giving large wallets outsized influence.
Staking participation has held up through the decline, suggesting core holders aren't rushing to exit.
BTC Dominance and ETH Correlation
BTC dominance has crept higher through July, a backdrop that usually pressures mid-cap layer-1s like ATOM. $Cosmos also tracks ETH correlation closely, and Ethereum's own choppy month has offered little relief.
Until dominance cools or altcoins catch a bid, ATOM's short-term forecast stays capped near current resistance.
August 2026 Catalysts That Could Move $Cosmos
Renewed IBC activity, stronger staking, or a risk-on shift tied to Fed rate expectations could lift this atom's monthly forecast.
Continued Bitcoin weakness would drag $ATOM lower regardless of $Cosmos news, since most moves trace back to macro cues, a key factor in any ATOM forecast 2026 read.
Cosmos Long-Term Outlook: 2027 to 2030
If the weekly channel breakout plays out, $2.71 and then $3.25 become realistic waypoints over the following months, with $3-$5 achievable by 2027-2028 if altcoin conditions cooperate.
Double digits by 2030 would still need a full market cycle turn.
Compared to SUI or NEAR, Cosmos needs a clearer growth story to justify aggressive $Cosmos future price targets. $1,000 in ATOM today would need roughly a 2.6x move to reach the weekly chart's $3.25 target.
What Analysts Are Forecasting
Every $Cosmos coin prediction model reviewed for this cosmos prediction chart update lands in a similar zone.
Several trackers see ATOM averaging $1.20-$1.50 through August, close to our base case, while more bullish models point toward $2 if the wedge breakout confirms.
None support a return to prior highs within 12 months given current supply and demand, keeping this $Cosmos price prediction august 2026 realistic rather than a moonshot.
Risks That Could Invalidate This Forecast
A sharp Bitcoin selloff, a high-volume break of $1.17, or a broader risk-off shift would invalidate the base case.
A surge in IBC activity or rotation into mid-cap layer-1s could push targets higher than modeled. Regulatory developments affecting the wider altcoin market remain a wildcard.
Final Outlook
In the short term, $ATOM needs a confirmed move above $1.60 before the atom-bullish forecast gains credibility.
Whether it's an ATOM buy or sell decision, this cosmos price prediction today favors waiting for confirmation over guessing which way the wedge breaks.
Longer-term holders betting on interoperability adoption may find current levels attractive but should size positions, knowing the downside toward $1.17 or $0.47 stays live.
Expert Opinion
Our analyst desk sees ATOM at one of its more decisive technical points of the year.
This Cosmos price prediction August 2026 needs a volume-backed breakout before it turns convincingly bullish, and that hasn't happened yet on either chart.
Until Bitcoin dominance eases or Cosmos news breaks the pattern, treating $1.17 and $1.60 as the operating boundaries looks more disciplined than betting on either extreme.
Glossary
Support level is basically the price floor where buyers have historically stepped in often enough that traders expect it to hold again.
The resistance level works the other way, a ceiling where sellers keep showing up.
A falling wedge is a pattern where price makes lower highs and lower lows that squeeze together, often setting up a sharp move once it resolves.
BTC dominance measures how much of the total crypto market's value sits in Bitcoin versus everything else, and when it climbs, altcoins like ATOM tend to feel the squeeze.
Methodology
This forecast is built from ATOM's 1D and 1W chart structure, recent trading volume,
Fibonacci retracement levels and current market sentiment as of late July 2026.
All price levels referenced are chart-derived and not extrapolated. Forecasts are probabilistic, not guarantees, and should be treated as one input among many in your own research process.
Disclaimer: Cryptocurrency prices are highly volatile and speculative. This is not financial advice. Figures cited here, including probability-weighted scenarios, are estimates based on available chart and market data as of publication and can change quickly. Never invest more than you can afford to lose, and consult a licensed financial advisor before making investment decisions.
0
0

 Manage all your crypto, NFT and DeFi from one place
Securely connect the portfolio you’re using to start.

0
0

0
0

0
0
