PEPE Price Prediction – 15% Surge Sets Stage For Run To New ATH
15d ago•

bullish:
0
bearish:
0
Share
Key Takeaways:
- PEPE price gained over 15% in the last two sessions and traded above $0.00000750.
- There was a close above a major bullish flag with resistance at $0.00000750 on the daily chart.
- The price could continue to rise if it stays above the 50-day simple moving average (blue) and $0.0000070.

NEW DELHI (CoinChapter.com) — PEPE price rallied from the $0.00000515 support. It cleared the $0.00000750 resistance and eyes more upsides toward the $0.000010 level.
PEPE Price Signals Fresh Rally
In the last analysis, we discussed the chances of more upsides in PEPE. The price remained in a bullish zone and dips were attractive to the bulls. There was a sharp decline toward the $0.00000515 support before a fresh surge.
The price trimmed all losses and climbed above the $0.0000070 resistance. There was a clear move above the 61.8% Fib retracement level of the downward wave from the $0.00000822 swing high to the $0.00000515 low. It outperformed Bitcoin and settled above the 50-day simple moving average (blue).
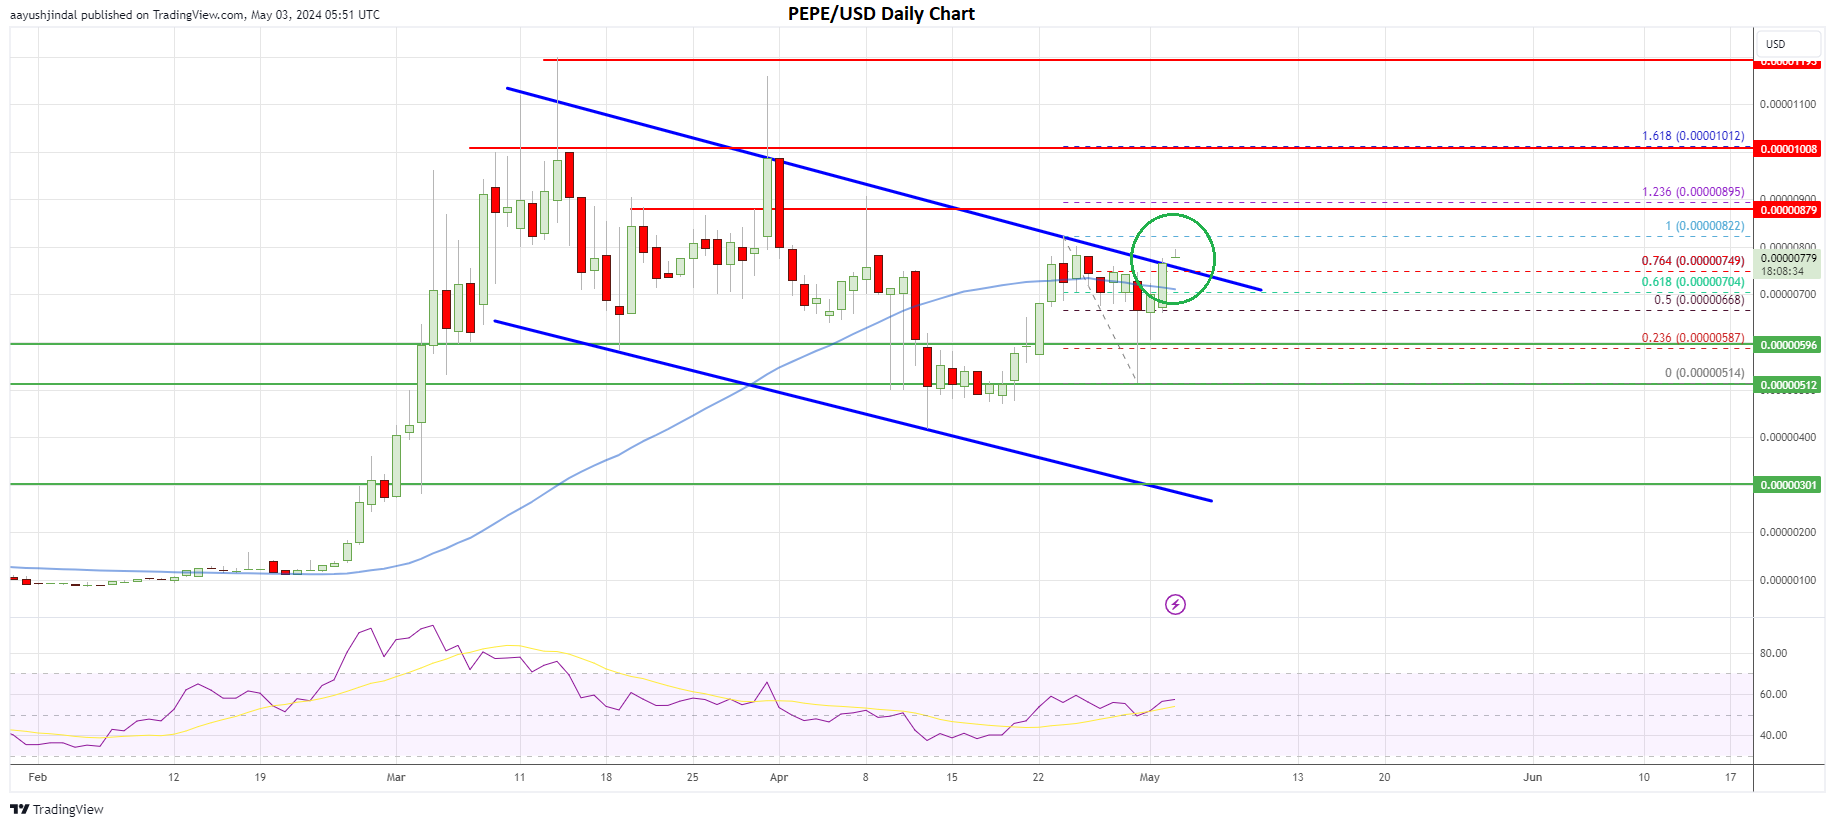
More importantly, PEPE price cleared a major bullish flag with resistance at $0.00000750 on the daily chart. Today, the price is up over 15% and signaling a positive momentum above $0.00000750.
Immediate resistance is seen near the $0.00000822 high. The first major resistance is near the $0.0000090 zone or the 1.236 Fib extension level of the downward wave from the $0.00000822 swing high to the $0.00000515 low.
A close above the $0.0000090 level could set the pace for a move toward the $0.000010 resistance. The next major resistance might be near the last high at $0.0000116. A daily close above the $0.0000116 resistance zone could open the doors for a move toward the $0.0000150 region.
Another Dip?
Conversely, PEPE price might struggle near $0.0000082 and start a downside correction. Immediate support is near the $0.00000750 level. The first major support is near the $0.0000070 zone and the 50-day simple moving average (blue).
A close below the $0.0000070 support might send the price toward the $0.00000515 low. If the bulls fail to protect the $0.00000515 support, there could be a larger decline. In the stated case, the price might decline toward the $0.0000030 support.
Recently, Kraken announced new margin pairs for a few altcoins, including PEPE. Two other meme coins were included – SHIB and WIF.
— Kraken Pro (@krakenpro) May 2, 2024
New margin pairs now available for:
$ICP @dfinity
Gain exposure to these tokens and 120+ margin pairs on Kraken
*Geographic restrictions apply
Trade nowhttps://t.co/wYKejnxiyV pic.twitter.com/uXH2PyM0YL
Overall, PEPE price is signaling an upside break above $0.00000750. If the price stays above the 50-day simple moving average (blue), it could extend gains and revisit the $0.000010 level.
The post PEPE Price Prediction – 15% Surge Sets Stage For Run To New ATH appeared first on CoinChapter.
15d ago•
bullish:
0
bearish:
0
Share

 Manage all your crypto, NFT and DeFi from one place
Securely connect the portfolio you’re using to start.

bullish:
0
bearish:
0

bullish:
0
bearish:
0

