
Chainlink Price Prediction: Can LINK Clear Its 2026 High Of $15.78?

0
0

Chainlink price prediction is the search that suddenly matters again, because this chart is building toward a decision.
Traders are watching one line, two levels, and a very short window to act. Read this before the next candle rewrites the story.
Our editorial desk holds no personal position in LINK. This is a chart and data read, nothing more.
LINK Price Today: Live Chainlink Price, Volume, and Market Cap
The token trades near $14.459, up 0.48% on the day, per CoinGlass. Market capitalization stands at $10.83B.
Futures volume over 24 hours reached $767.82M against $155.88M in spot volume, so derivatives activity runs roughly 4.9 times the spot flow.
Open interest, the total value of unsettled futures contracts, is $784.81M. Circulating supply is 748.09M LINK out of a 1.00B maximum.
The CMP (current market price) used for every level below comes from the TradingView chart, not this snapshot.
Source: CoinGlass, October 1, 2026
Chainlink News Today: Santiment Data Shows Wallet Count Falling
Not every holder is staying put. BSCN (@BSCNews) reported on X that Santiment analysis shows fewer non-empty Chainlink wallets after the token reached its 2026 price high. 
Smaller holders look to be booking profit into strength. The counter-argument in the post is that long-term buyers keep accumulating and are absorbing that supply.
If that holds, the falling wallet count is distribution from small hands, not a loss of conviction among large ones. The post ended with a shrug, and price action will settle it. For wider context, see our LINK staking rewards explained guide.
Source: BSCN (@BSCNews) on X, October 1, 2026
Chainlink Price Prediction Technical Analysis: LINK Price Forecast
Methodology: 1-hour timeframe, Binance LINK/USDT spot, the oscillator panel shown on the chart, and invalidation set at a 1-hour close below $13.446.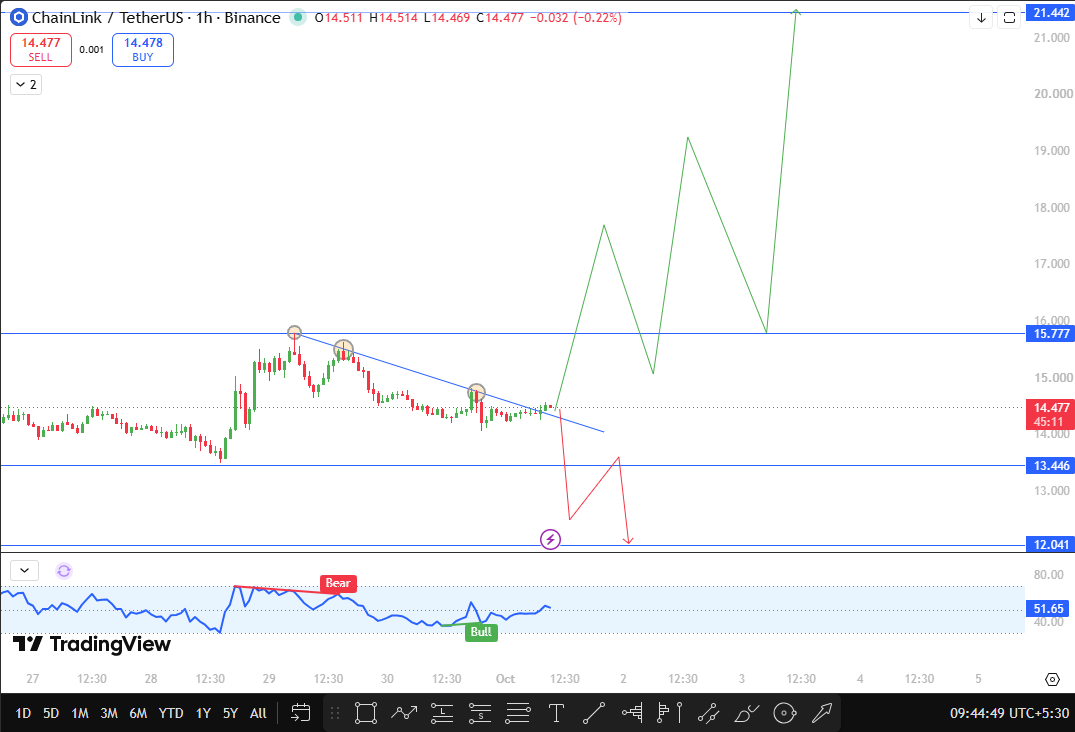
After the swing high at $15.777, the market stepped down along a descending trendline. Price touched it, got rejected, came back for a second retest, and has now pushed up through the line. The latest candle is down 0.22%, so the breakout is attempted, not proven.
A hold above the trendline followed by a 1-hour close above $15.777 would clear that high and expose $21.442, about 48.11% above CMP. The projected route on the chart is a staircase, with pullbacks into the $15 to $16 area before each new leg.
Our Chainlink oracle network guide covers why traders follow this asset so closely.
The failure case is just as clear. A 1-hour close below $13.446 turns this into a failed breakout and points to $12.041, about 16.83% below CMP. The bearish path on the chart shows a quick drop, a weak bounce toward $13.4, and then a slide to the lower support.
The oscillator reads 51.65, mid-range and not stretched either way. A "Bear" divergence label sits near the recent highs, where momentum faded against price, and a "Bull" label sits near the lows, where momentum recovered first.
Together they describe a market without a clear momentum edge. A crypto breakout trading guide is useful here, since a breakout without a close beyond the key level proves little.
Source: TradingView, LINK/USDT 1H, Binance, October 1, 2026, 9:44 AM IST
LINK Support and Resistance Levels: Key Price Targets Explained
Level | Role | Distance from CMP |
$21.442 | Major resistance and bullish target | +48.11% |
$15.777 | Breakout trigger and swing high | +8.98% |
$14.477 | CMP | 0.00% |
$13.446 | Breakout failure level | -7.12% |
$12.041 | Next support | -16.83% |
Chainlink Price Outlook: Bull, Base, and Bear Scenarios for Today
Bull case: Buyers defend the trendline, and a 1-hour candle closes above $15.777. That clears the 2026 high and leaves little overhead until $21.442, roughly 35.9% of the room from the trigger. Expect wobbles. A retest of $15.777 that holds as support would be the cleanest version of this move.
Base case: The market drifts between $13.446 and $15.777 while it works out whether the trendline break is real. Bulls lose some patience but keep their structure, and spot buyers keep soaking up supply from smaller wallets.
Bear case: A 1-hour close under $13.446 wipes out the breakout attempt. Sellers then aim at $12.041, about 10.45% below that level, and the fall in wallet count would carry more weight. Watch how fast the market bounces. A weak bounce would confirm the sellers are in charge.
Chainlink Price Risks: What Could Stop This Breakout Setup Fast
Derivative volume dwarfs spot volume, so liquidation wicks can poke through a level for a moment. Under our rule, a wick below $13.446 that closes back above it does not count as failure. Profit-taking from smaller wallets could also cap rallies near $15.777.
The oscillator's divergence label near the highs is a reminder that momentum has faded before. This is a single 1-hour read, so a broader market move can override it quickly. A spot crypto ETF inflow update helps track bigger money.
Trading Terms Glossary: Breakout, Retest, and Divergence Explained
Retest: price returning to a broken or tested level to check whether it holds.
Divergence: price and the oscillator moving in different directions, often hinting that momentum is changing.
Open interest: the total value of futures contracts still open.
Disclaimer
This article is for information and education only and is not financial advice. Crypto is volatile, and you can lose money. Do your own research and speak with a licensed advisor before investing.
0
0

 Manage all your crypto, NFT and DeFi from one place
Securely connect the portfolio you’re using to start.


