Arbitrum (ARB) Price Prediction 2025–2030: Will ARB Hit $1.60 Soon?
0
0

- ARB rallies from $0.45 accumulation zone, breaking out above $0.50 into a rising parallel channel.
- RSI cools to 55.3 after an overbought spike, indicating room for consolidation before another move.
- Supertrend flips bullish at $0.51, with Fibonacci targets pointing to $0.74 and $0.85.
Arbitrum (ARB) has bounced back after weeks of being pushed down, re-taking critical technical levels and flipping market sentiment to its advantage. Having briefly reached the value of $0.61, the token is currently trading at around $0.588 and must now pass the crucial psychological barrier of $0.60, which will determine whether the momentum will continue to higher Fibonacci levels.
The on-chain activity is moderate with moderate exchange outflows of $0.77 million, indicating that accumulation pressure exists. In combination with the technical reversals, ARB is now poised to achieve potential medium-term gains even though it might experience short-term volatility.

Source: Coinglass
Also Read: Pump.fun (PUMP) Price Prediction for August 24, 2025
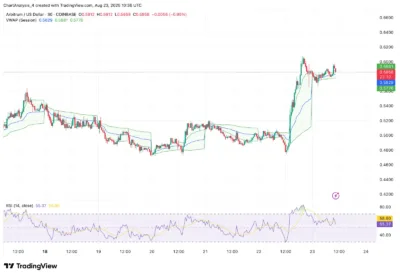
RSI Behavior
The 30-minute RSI has now settled to 55.3, down from highs above 70 when ARB first raced past 0.50. This indicates that there is a consolidation; however, RSI levels are neutral-to-bullish as long as they are above 50.
A break above 60 once again would indicate that buyers are once again in control. On the other hand, declines to 45-50 may be followed by a test of the support at $0.55.

Source: Tradingview
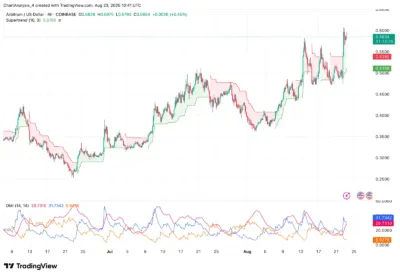
Supertrend and DMI
The Supertrend indicator on the 4-hour timeframe has turned bullish and is resting at around $0.51, creating a firm support cluster with the base of the rising channel. This level has become a make-or-break point to be held by the bulls.
Simultaneously, the DMI displays the +DI line above the -DI, and the ADX is growing. This reinforces the existing uptrend and the bullish pattern.

Source: Tradingview
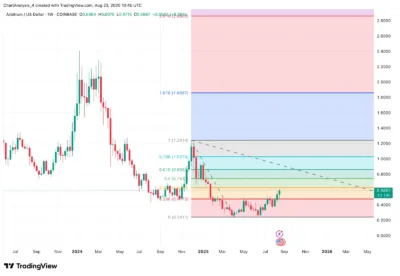
Fibonacci Levels
Arbitrum has re-taken the $0.382 retracement at $0.56, which is an essential technical milestone. The next challenge is the $0.5 retracement at $0.74, which represents the medium-term upside target.
In the event of momentum continuation, ARB has the potential to rise to $0.85, the next bullish milestone. A breach of the support at the $0.50 price point, however, would invalidate this pattern and turn the picture bearish.

Source: Tradingview
Support and Resistance
Resistance levels currently stand at $0.60, followed by $0.65–$0.70. These areas should be cleaned up so that ARB can gain upward momentum and reach $0.74.
The bullish breakout has support at $0.55, $0.51, and $0.50 as the invalidation points. A breakdown of these areas would see the price retrace back to the $0.45 accumulation base.
Arbitrum (ARB) Price Prediction Table (2025–2030)
| Year | Minimum Price | Average Price | Maximum Price |
| 2025 | $0.45 | $0.60 | $0.74 |
| 2026 | $0.51 | $0.70 | $0.85 |
| 2027 | $0.58 | $0.78 | $1.05 |
| 2028 | $0.65 | $0.92 | $1.28 |
| 2029 | $0.72 | $1.08 | $1.42 |
| 2030 | $0.85 | $1.25 | $1.60 |
Year-by-Year Price Breakdown
2025
If ARB consolidates above $0.60, bulls could aim for $0.74, the 0.5 Fibonacci retracement. Support at $0.55 and $0.51 must hold to preserve the breakout.
2026
A break above $0.70 would give ARB scope to test $0.85. A drop below 0.51 would not completely kill the bullish trend, but it would weaken it.
2027
By 2027, ARB may be driven to the price of $1.05, passing the $1.00 mark. This breakout is likely preceded by sideways consolidation between $0.78 and $0.90.
2028
Further momentum may take ARB to 1.28. The long-term structure integrity is based on keeping the support in the range of $0.92.
2029
In a healthy cycle, ARB could reach $1.42. This conforms to long-term Fibonacci extrapolations and past rally patterns.
2030
A long-term bullish scenario estimates that $1.60 will be reached by 2030. In this scenario, an ideal support base of $1.25 would act as the floor.
Conclusion
The breakout of Arbitrum above the $0.45 base has changed its technical aspect. ARB is in a good position with bullish Supertrend orientation, reinforced DMI indicators, and vital Fibonacci levels recovered, and it is likely to continue rising.
Near-term corrections can occur at the $0.60 mark, but as long as the asset remains above the $0.51 level, the path is toward the $0.74 and $0.85 levels. At the current rate of adoption, by 2030, ARB can achieve $1.60, a good long-term extension of the cycle.
FAQs
1. Why did ARB surge in August?
The breakout above $0.50, coupled with accumulation flows and bullish technical signals, triggered a rally.
2. Is ARB overbought right now?
No. RSI has cooled to 55.3 after being overbought, suggesting consolidation rather than exhaustion.
3. What are the critical support levels?
Support lies at $0.55 and $0.51, with $0.50 as the invalidation level.
4. What confirms ongoing bullish momentum?
The Supertrend bullish flip, rising ADX in the DMI, and Fibonacci reclaim at $0.56 confirm strength.
5. What upside targets are in play?
The near-term targets are $0.65–$0.74, with $0.85 projected for 2026. The long-term projections extend to $1.60 by 2030.
Also Read: Virtuals Protocol (VIRTUAL) Price Prediction 2025–2029: Can VIRTUAL Hit $5.00?
The post Arbitrum (ARB) Price Prediction 2025–2030: Will ARB Hit $1.60 Soon? appeared first on 36Crypto.
0
0
 Manage all your crypto, NFT and DeFi from one place
Securely connect the portfolio you’re using to start.


