
Is Ethena a Good Buy at Current Prices?

0
0

Ethena's governance token ENA trades at 0.1927 US dollars on 20 September 2026, roughly 71.4 percent below its twelve-month high of 0.6729 dollars from 20 September 2025, and about 170.4 percent above its twelve-month low of 0.0713 dollars from 2 July 2026. That spread frames the question this article sets out to answer: is Ethena a good buy at current prices, or has the easy part of the recovery already happened?
cryptoticker.io collected the price data behind this analysis on 20 September 2026. The market data comes from CoinMarketCap, the calculations use daily closing prices over the past 365 days and standard formulas: exponential moving averages over 200 and 50 days, and a 14-period RSI following Wilder's method.
Ethena price analysis: where the ENA price stands right now
The current ENA price of 0.1927 dollars sits well above both of the moving averages that matter for trend assessment. The 200-day exponential moving average stands at 0.1387 dollars, the 50-day exponential moving average at 0.1328 dollars. The token trades about 38.9 percent above its 200-day line and about 45.1 percent above its 50-day line, an unusually wide gap and a sign of how fast the move off the July low has been.
The zone that now matters most is the one between 0.13 and 0.14 dollars, where the two averages sit almost on top of each other. That is the first serious support below the market: a pullback into that band would leave the recovery intact, while a daily close underneath both lines would undo the technical improvement of the past three months. Above the current price, the twelve-month high of 0.6729 dollars remains far out of reach.
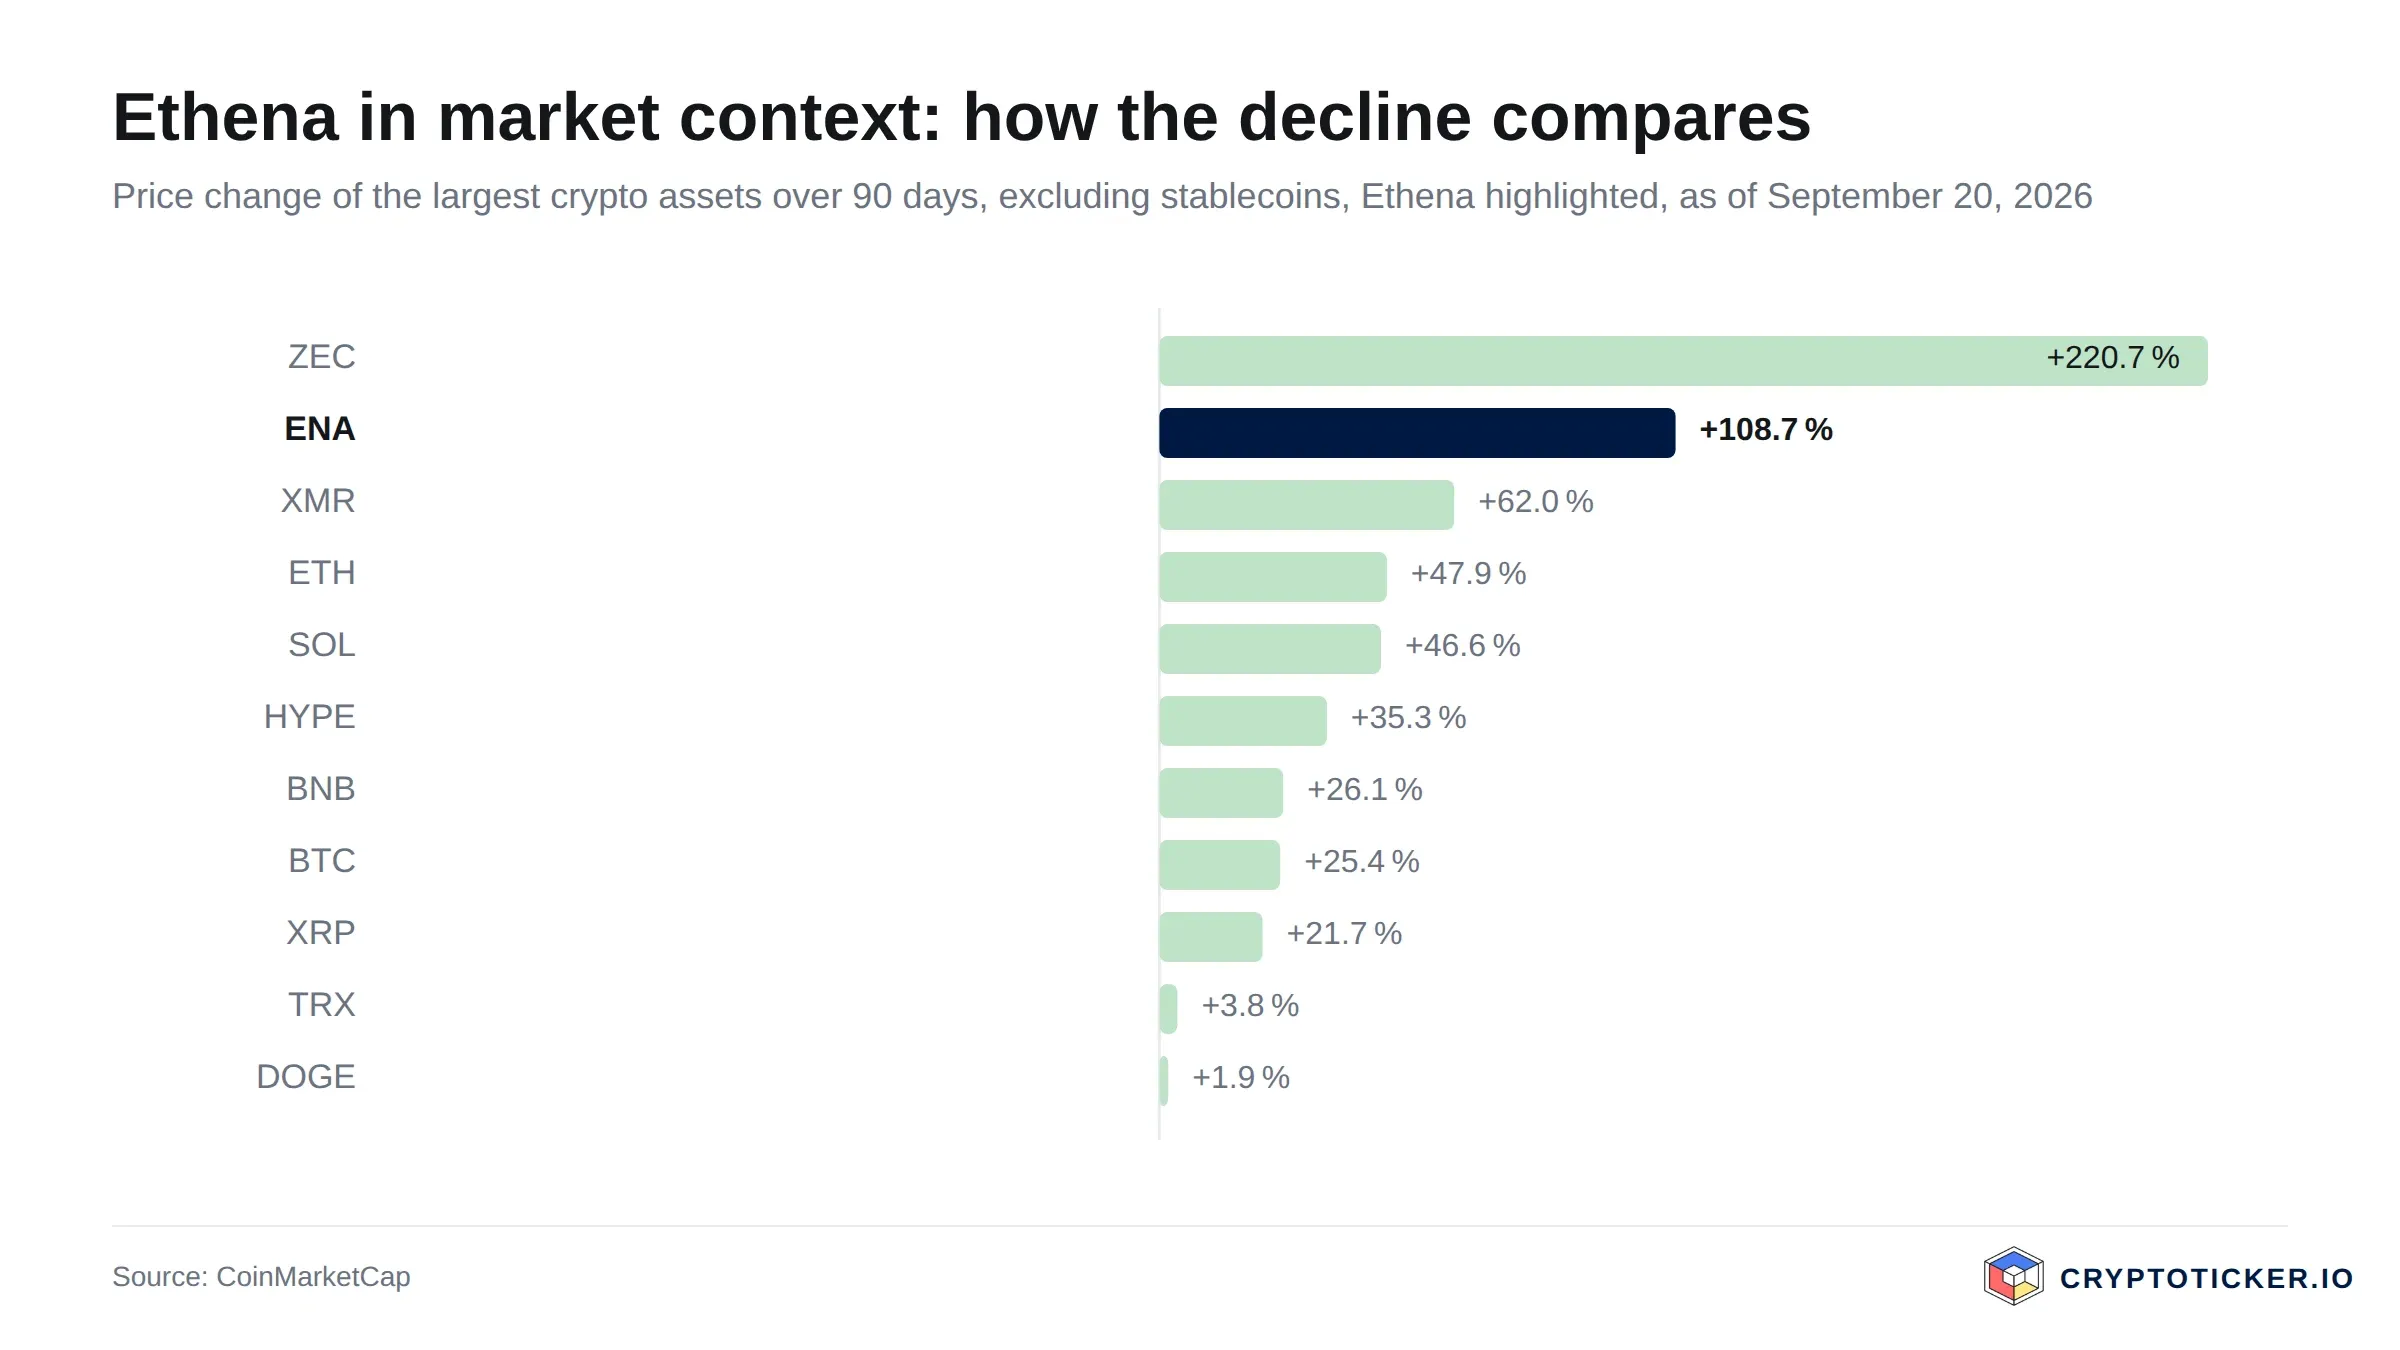
The shorter-term picture is equally stretched. ENA has gained 8.78 percent in 24 hours, 36.71 percent over seven days, 57.93 percent over 30 days and 106.93 percent over 90 days, while over the full twelve months it is still down 71.4 percent. Both statements are true at once, and which of the two an investor weighs more heavily largely determines how the current price looks to them.
Is the Ethena downtrend broken or only interrupted?
A downtrend is usually considered broken when price reclaims its long-term average and holds it, and when successive lows stop falling. ENA meets the first half of that test: the token has moved from 0.0713 dollars in early July to 0.1927 dollars today and has pulled the 50-day average back above the 200-day average, a crossover trend followers read as confirmation rather than as a signal in itself.
The second half is unfinished. A twelve-month chart that still shows a 71.4 percent drawdown describes a market that has rallied inside a larger decline. What would settle the question is a pullback that stops above the 0.13 to 0.14 dollar band and turns higher from there. Until such a retest happens, the honest reading is that the downtrend is interrupted and not yet demonstrably broken. That is an assumption about market structure, and a close back below the 200-day line at 0.1387 dollars would be the cleanest evidence against it.
What RSI and moving averages mean for an ENA entry
The 14-day RSI for ENA stands at 61.9, in the upper half of the neutral range and below the 70 mark conventionally treated as overbought. Momentum is firm without being extreme. For an entry decision that matters in a specific way: a reading near 62 after a 106.93 percent run over 90 days suggests the rally has cooled from its sharpest phase rather than exhausted itself.
The moving averages carry the more cautionary part of the story. Buying 45.1 percent above the 50-day average of 0.1328 dollars means paying for a move that has already happened. Prices that far from their medium-term average tend to consolidate or correct back towards it. The 0.1387 dollar level is the number to watch, because that is where a mechanical trend signal would flip.
What trading volume reveals about demand for Ethena
ENA turned over about 1.05 billion dollars in the past 24 hours against a market capitalisation of roughly 1.95 billion dollars. That ratio of about 54 percent is high by any standard: large-cap tokens typically trade between 3 and 15 percent of their market capitalisation in a day. Turnover of this size confirms that real order flow is meeting the move, and it also reflects short-term traders whose positioning can be unwound as quickly as it was built.
Ethena's ranking gives a sense of scale: ENA currently sits at rank 42 by market capitalisation. The broader backdrop is firm, with CoinMarketCap's Fear and Greed Index at 70, in greed territory. A sentiment reading that high is a reminder that the current price already contains a good deal of optimism.
Which structural factors speak for Ethena as an investment
Ethena's economics rest on a synthetic dollar, USDe, whose stability mechanism differs fundamentally from a reserve-backed stablecoin. Rather than holding fiat deposits, the protocol pairs spot collateral with short perpetual futures positions, so that gains and losses offset one another and the yield comes from funding rates plus staking income on the collateral. The mechanism and its risk parameters are set out in Ethena's own technical documentation, and we have explained how the yield is produced in our guide to the USDe yield.
That design creates a direct link between protocol revenue and the ENA token, which is the investment case in its simplest form. When funding rates are positive and USDe supply is large, the protocol earns; how much of that reaches token holders is the subject of the fee switch and buyback discussion we covered earlier this year.
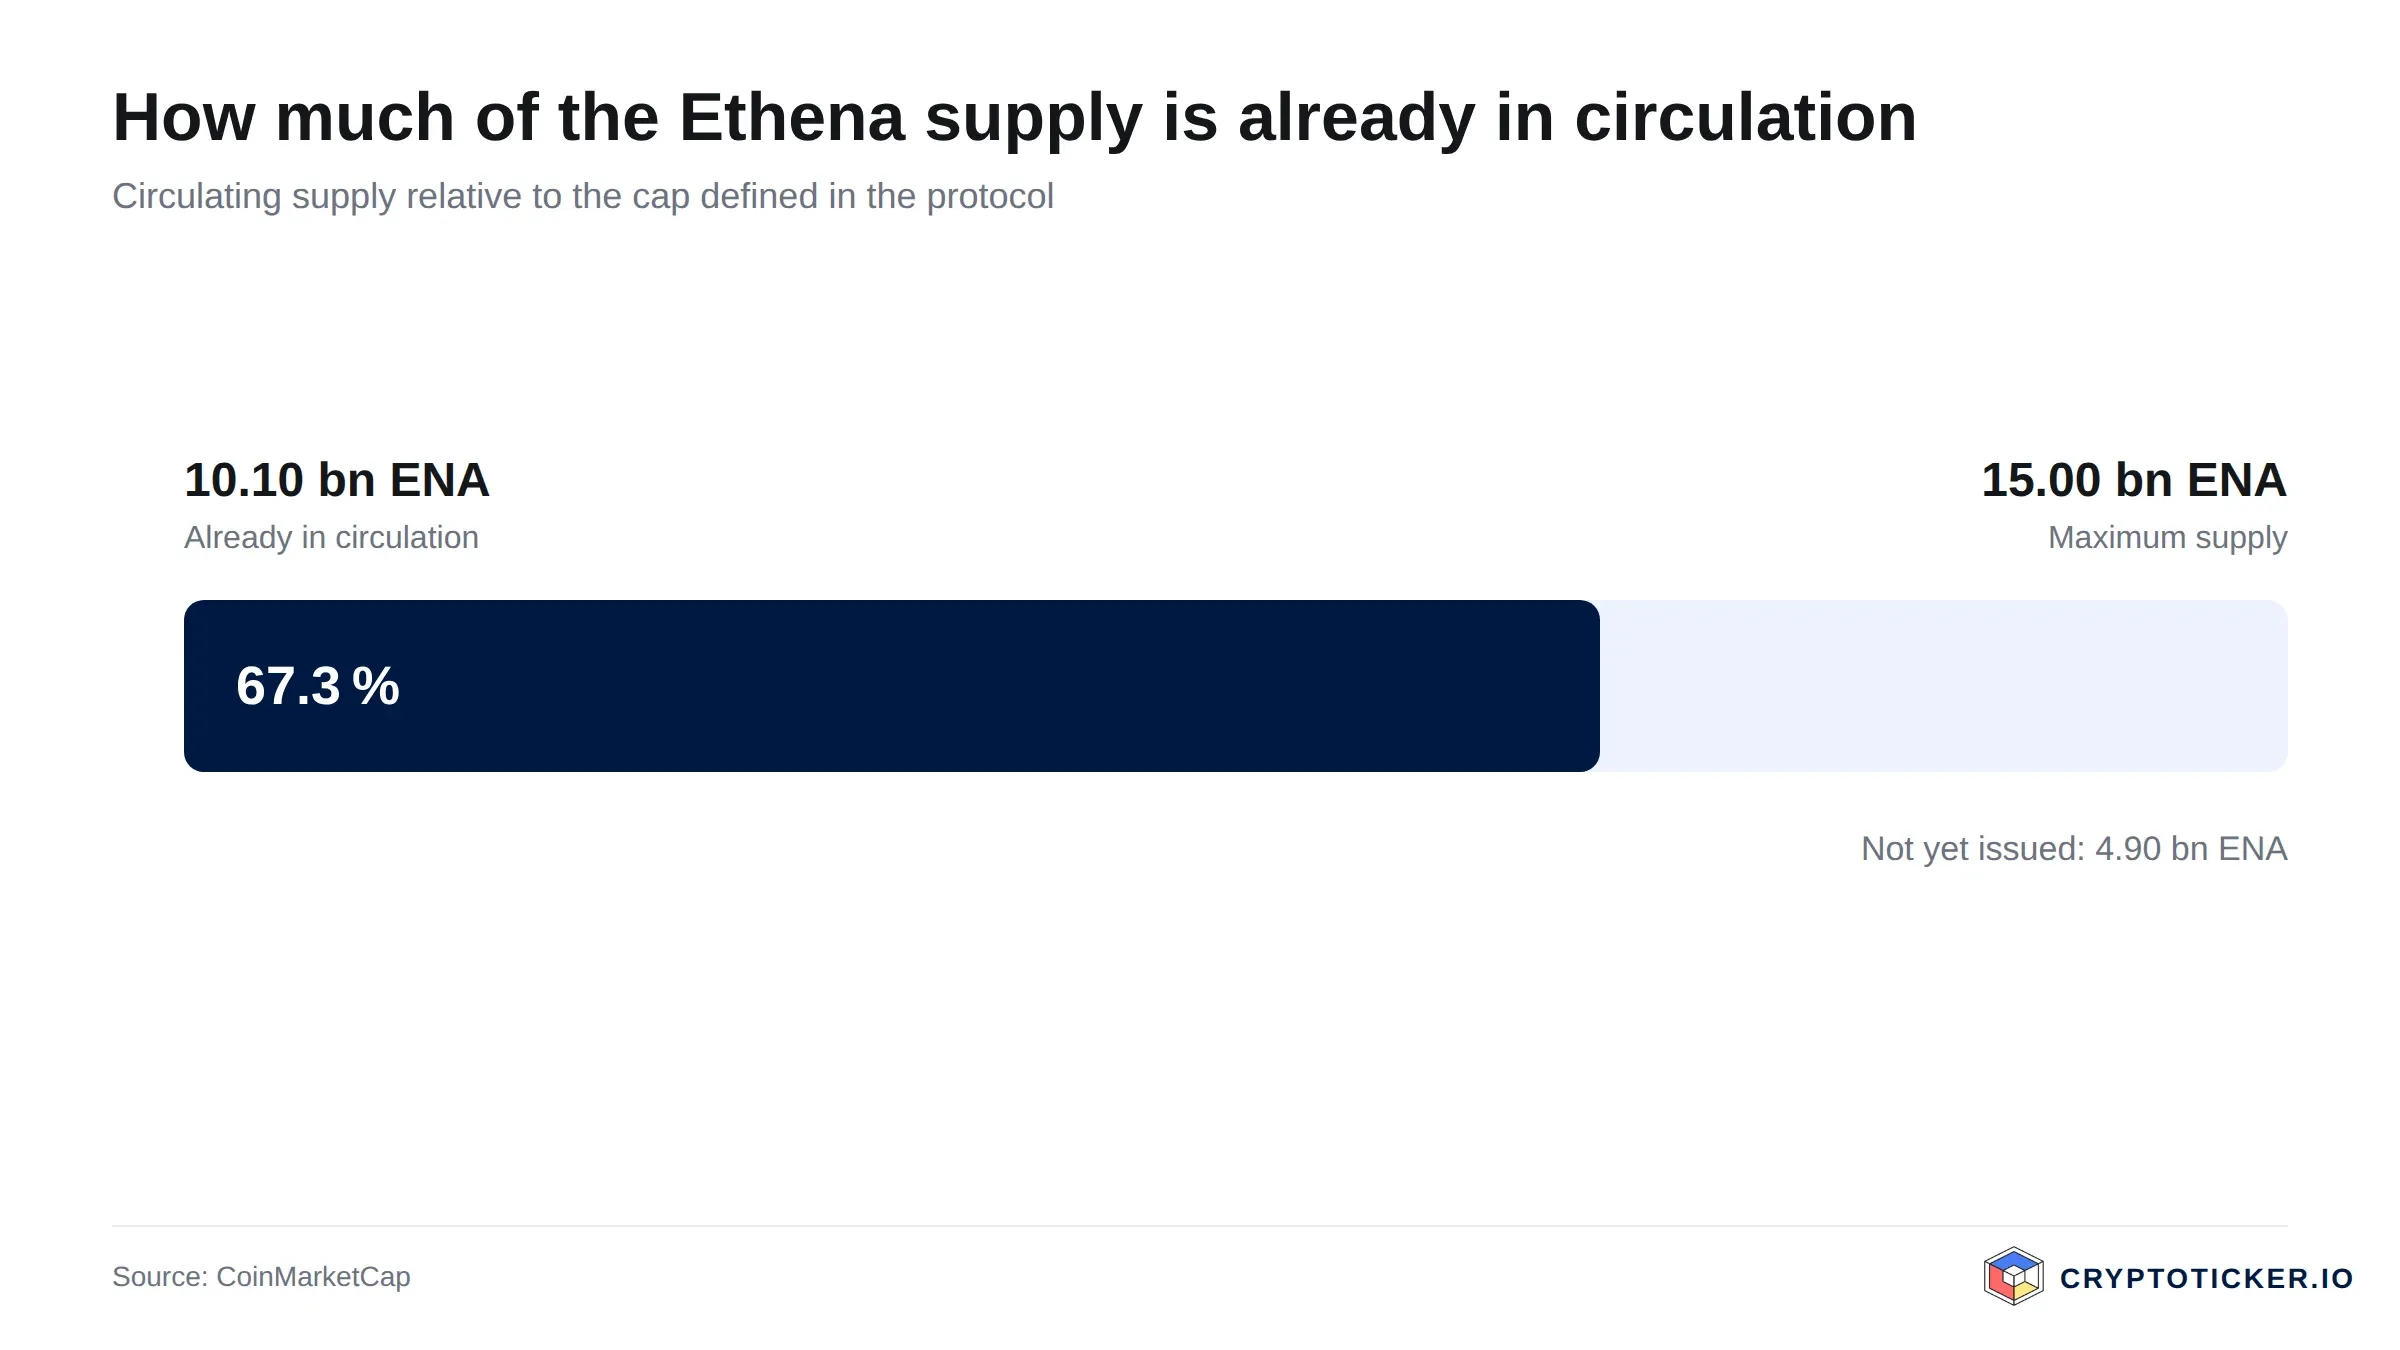
The supply mechanics cut the other way. Of a maximum supply of 15 billion ENA, about 10.1 billion are in circulation, or roughly 67 percent. The remaining third is scheduled to enter the market over time, and unlock schedules have moved this token's price before, as our reporting on the investor unlock described. Dilution of that magnitude is a structural headwind that a rising price does not remove.
Regulation is the third structural variable. In the European Union, ESMA and the national supervisors apply the MiCA framework, which sets authorisation requirements for asset-referenced and e-money tokens. Synthetic dollar designs that are not backed one for one by fiat reserves sit awkwardly against those categories, and how that is resolved will shape where USDe can be distributed in Europe. That is an open question rather than a settled fact, and one of the larger uncertainties in the investment case.
What speaks for buying Ethena at current prices
First, the trend has turned on the measures trend followers use. ENA trades above its 200-day average of 0.1387 dollars and above its 50-day average of 0.1328 dollars, with the shorter average back above the longer one. For a systematic approach, that combination is the entry condition, and it is currently met.
Second, the price is still 71.4 percent below the twelve-month high of 0.6729 dollars. Investors who believe the protocol's revenue model will survive a full funding-rate cycle are paying roughly a third of what the market paid a year ago for the same claim on that revenue.
Third, liquidity is not a constraint. Daily turnover of about 1.05 billion dollars against a 1.95 billion dollar market capitalisation means positions of retail size can be built and exited without moving the price, which is not true of every token in this size bracket.
What speaks against buying Ethena at current prices
First, the entry is extended. At 45.1 percent above the 50-day average and 38.9 percent above the 200-day average, a buyer at 0.1927 dollars pays a premium to the market's own medium-term reference price, and a mean reversion towards 0.13 to 0.14 dollars would represent a decline of roughly 28 to 32 percent without anything changing about the protocol.
Second, the supply overhang has not been worked through. With about 10.1 billion of a maximum 15 billion ENA circulating, the remaining tokens arrive against a market capitalisation of under 2 billion dollars. Absorbing them requires demand that grows at least as fast as supply, and that has not been the pattern over the past twelve months, during which the token lost 71.4 percent.
Third, the revenue model is cyclical by construction. USDe's yield depends on perpetual funding rates staying positive, which they tend to do in bullish markets and not in sustained bear phases. A token whose value case rests on protocol revenue inherits that cyclicality, and the current Fear and Greed reading of 70 suggests the market is pricing the favourable half of the cycle.
How to buy Ethena at current prices: costs, custody and providers
ENA is listed on most large centralised exchanges, so the practical differences between them are fees, regulatory status and withdrawal terms rather than access. Spot trading fees at the major venues typically run between 0.1 and 0.5 percent per trade for retail volumes, and on a token of this liquidity the spread is usually the smaller cost. Our exchange comparison sets the current conditions side by side, and our Bitpanda review goes through one European provider's fee structure in detail. Check fees at the provider before you trade: they change, and this article is a snapshot.
On custody, the choice is between leaving tokens with the exchange and withdrawing them to a wallet you control. Exchange custody is simpler and exposes you to the provider's solvency and security; self-custody removes that exposure and hands you responsibility for key management. Holders who intend to put ENA or USDe to work rather than hold it passively should read the terms first, and our staking platform comparison covers what the various providers charge and what lock-up periods apply.
Is Ethena a good buy at current prices, short term and long term?
For the short term, the setup is mixed and the price level is the reason. Momentum is intact, with an RSI of 61.9 and both moving averages beneath the market, but the distance to those averages is wide enough that a consolidation would be the normal outcome rather than a surprise. A buyer at 0.1927 dollars accepts a drawdown risk towards 0.1387 dollars as the cost of participating in a trend that is currently working.
For the long term, the question is not the chart but the revenue model and the supply schedule. The case holds if USDe supply grows, if funding rates average positive across a full cycle, if the fee mechanism directs a meaningful share of revenue to token holders, and if the European regulatory treatment of synthetic dollars settles in a workable form. The case is refuted if funding rates turn persistently negative, if the remaining 4.9 billion ENA enter the market faster than demand grows, or if MiCA implementation effectively closes the European distribution route.
Those conditions are testable, and this article issues no recommendation on how they will resolve. At 0.1927 dollars the market is no longer pricing Ethena for failure, as it arguably was at 0.0713 dollars in July, and the margin of safety has narrowed accordingly.
Buying Ethena: what to take away
- The trend has turned but the entry is expensive. ENA at 0.1927 dollars trades 38.9 percent above its 200-day average of 0.1387 dollars and 45.1 percent above its 50-day average of 0.1328 dollars. The 0.13 to 0.14 dollar band is where the technical case would break. For a comparable analysis of another protocol token, see our assessment of Aave at current prices.
- The investment case is a bet on protocol revenue rather than on a network. Yield comes from funding rates and staking income, which makes it cyclical; how much of it reaches token holders is the open question we examined in our report on the fee switch and buyback debate.
- Supply and regulation are the two structural risks. Roughly a third of the maximum 15 billion ENA has yet to enter circulation, and the European treatment of synthetic dollars is unresolved. Before choosing where to buy or hold, compare the conditions in our exchange comparison.
Disclosure: Some of the providers mentioned in this article work with us through partner programmes. This has no influence on the price analysis or on the assessment of the chart situation; the price data comes from a public market data source and can be verified there.
(As of 20 September 2026. This article is not investment advice. Prices, fees and conditions change; check them with the provider yourself before any purchase. Crypto assets are subject to high price volatility, and a total loss is possible.)
0
0

 从同一位置管理所有加密资产、NFT 和 DeFi 资产
安全地关联您正在使用的投资组合,以开始交易。


