BNB Price Forecast: Bullish Momentum or Consolidation?
1M ago•

bullish:
1
bearish:
0
Share

The BNB price may be bracing for a consolidation phase, as indicated by the stabilization in the number of transactions over the past week. Currently, BNB’s RSI stands at a lofty 84, signaling overbought conditions that could dampen the prospects of any immediate surges in price.
Supporting this, the EMA lines provide strong underpinnings for a sustained period of consolidation, suggesting a steadier market ahead for BNB.
BNB Number of Transactions Remains Stable
BNB’s number of transactions has remained pretty stable since the end of February 2024. Its price soared from $313 on January 1 to $632 by March 15. That represents a 101% increase in just over two months. Then, the BNB price corrected, reaching $507 on March 19. After that, it had a new surge, reaching $578 on March 27.
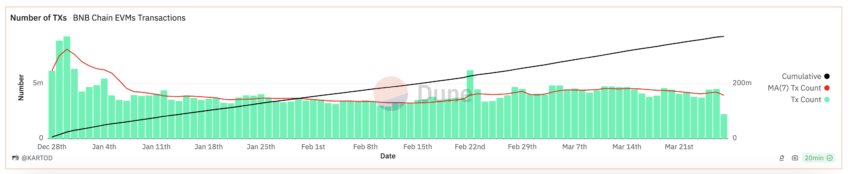 BNB Daily Number of Transactions. Source: Dune.
Compared with the leading 21 cryptos by market cap, ignoring memecoins and stablecoins, BNB’s annual growth trails only NEAR, BCH, and TON.
The steady daily transaction count and uniform 7-day moving average imply unwavering investor trust in BNB. Even after notable gains this year, the promise of ongoing robust returns may keep investors focused on BNB.
Read More: How To Buy BNB and Everything You Need To Know
BNB High RSI Could Prevent New Push Higher
With BNB’s Relative Strength Index (RSI) peaking at 84, it has entered the overbought territory. That implies that the market could be overvaluing the asset at this point. Such a high RSI often serves as a cautionary signal that the asset might not sustain further growth in the short term. This happens due to the heightened likelihood of a price correction.
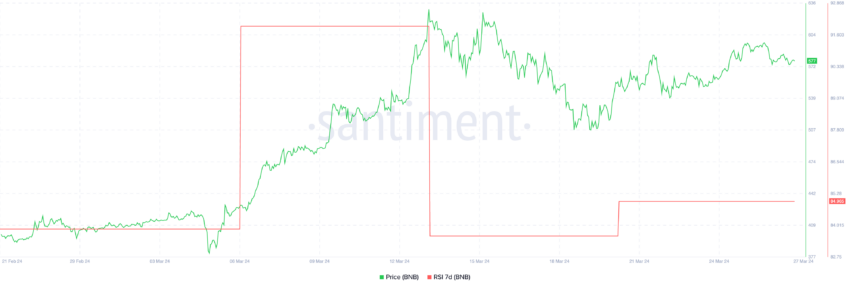 BNB RSI 7D. Source: Santiment.
The RSI tracks the velocity of price shifts, assessing if an asset is overbought or oversold between 0 and 100. BNB’s high RSI hints at extensive buying, raising the odds of an impending consolidation alongside steady transaction volumes.
At this RSI level, traders might infer that BNB’s purchasing momentum has peaked, possibly curtailing imminent rallies in the short term.
BNB Price Prediction: Consolidation Ahead or New Push Above $645?
The BNB price chart shows that a shorter-term Exponential Moving Average (EMA) has just crossed above a longer-term EMA. This is typically regarded as a bullish signal, indicating that recent price momentum is strong and could lead to further price increases.
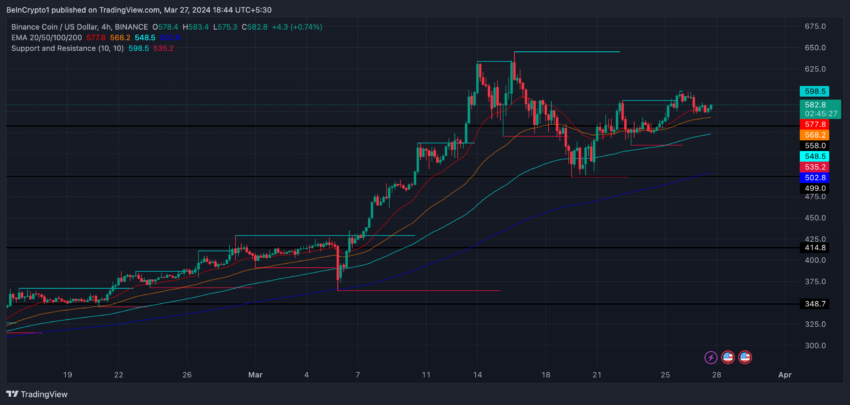 BNB 4-hour Price Chart and EMA Lines. Source: TradingView.
EMA lines are a type of moving average that gives more weight to recent prices, making them more responsive to new price movements compared to simple moving averages. The crossing of a short-term EMA above a longer-term EMA suggests that buyers are regaining control and could push the price higher.
Read More: Top 10 Cryptocurrencies to Invest in March 2024
If BNB maintains its current pace and steers clear of a consolidation, the price may challenge and exceed the $645 resistance. These outcomes depend on consistent market conditions and avoiding a price-stabilizing consolidation. Should a decline begin, the BNB price could approach the $497 support.
1M ago•
bullish:
1
bearish:
0
Share


 Manage all your crypto, NFT and DeFi from one place
Securely connect the portfolio you’re using to start.

bullish:
0
bearish:
0

bullish:
0
bearish:
0


bullish:
0
bearish:
0