Pepe’s Bullish Rally Forms Bullish Pattern, Traders Remain Optimistic
25d ago•

bullish:
0
bearish:
0
Share

NOIDA (CoinChapter.com)— Pepe’s bullish rally over the weekend helped the token reach a daily high near $0.000009 on May 13. Bearish pressure against PEPE prices forced the token to pare gains despite traders being generally bullish on Pepe coin’s prospects.
Being a memecoin, the PEPE price relies heavily on social media hype as a bullish cue. As such, the meme crypto token is not lacking in cues, with several traders sharing their bullish outlook for the token on social media.
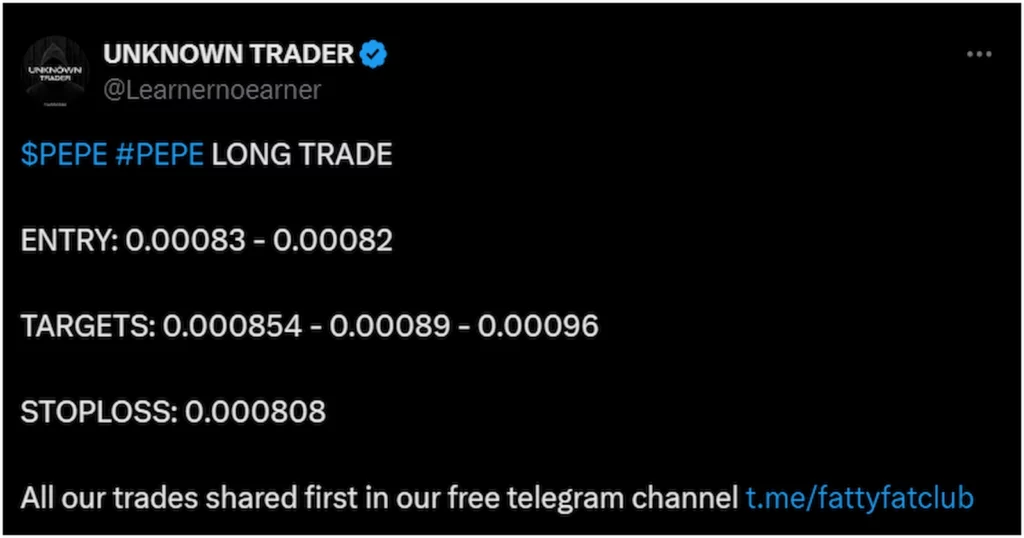
A post on social media platform X suggested opening long positions favoring the PEPE coin, highlighting the bullish sentiment among market participants.
Furthermore, Pepe’s bullish rally has formed a bullish technical pattern, which could add further supporting cues for the token.
PEPE Price Forms Bullish Pattern
PEPE price has formed an ‘ascending triangle‘ pattern.
Historically, a horizontal trendline connecting swing highs and an ascending trendline connecting swing lows form an ascending triangle pattern. Moreover, the volume helps determine whether a breakout is strong. Under ideal conditions, buyers would enter the market as the trendlines close the gap.
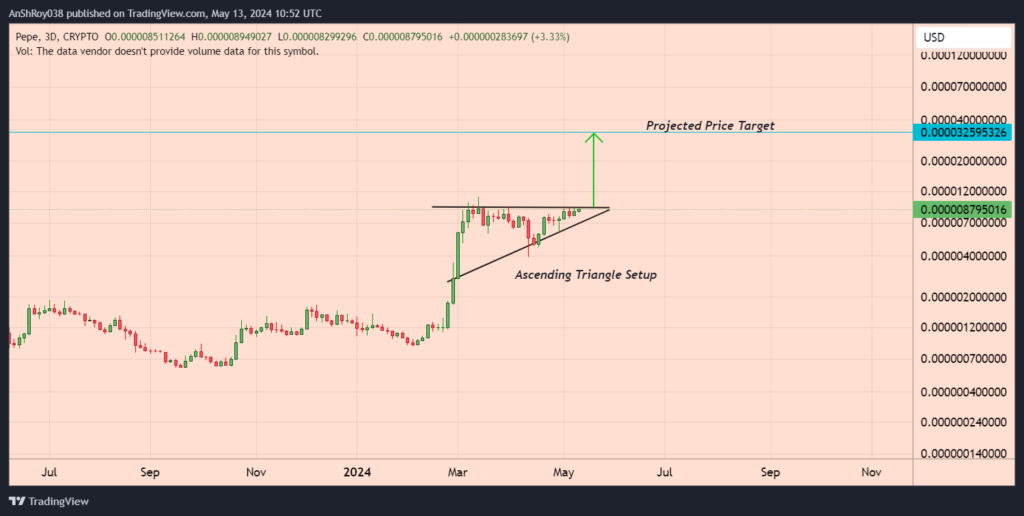
As a result, the token’s price would push above the horizontal resistance with heavy volumes.
Per the rules of technical analysis, the price target for a breakout is equal to the triangle’s height at its thickest point. If the bullish pattern pans out, PEPE coin price has a theoretical price target near $0.000033, a spike of 275% from current levels.
It is unlikely that the Pepe coin price token price would rally immediately to the pattern’s target after a successful breakout. Yet, the pattern could attract buyers to the market, helping the memecoin start a bullish run.
PEPE Bulls Aim To Remove A Zero From Price Tag
Meanwhile, PEPE price’s recent rally helped the token rise to its highest levels since March 15 earlier this year. Moreover, PEPE price started the week with a 17.2% spike on May 13, reaching a multi-week high near $0.00000973.
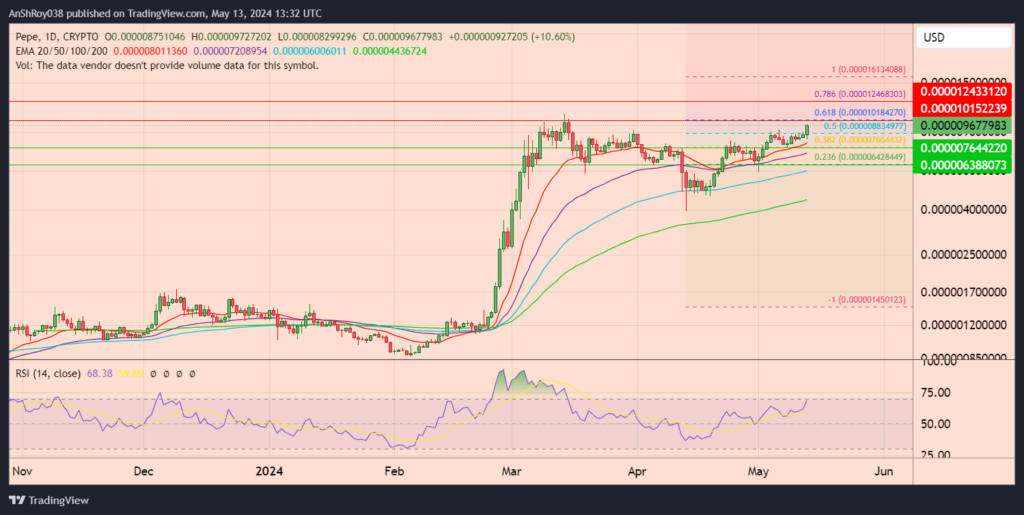
If the rally continues, PEPE price might rally to the resistance near $0.00001, achieving a vital psychological milestone by removing a zero from the token’s price label.
Furthermore, breaking and consolidating above the immediate resistance might help the memecoin rise to the resistance near $0.0000124 before paring gains.
Notably, the relative strength index for PEPE remains neutral for now, with a score of 68.38 on the daily charts. However, the RSI level remains uncomfortably close to the overbought threshold of 70. Indeed, crossing this threshold would result in a bearish reversal signal for PEPE coin price.
As a result, the token might drop to the support near $0.00000764. Moreover, failure of the immediate support level would force PEPE coin price to test the 100-day EMA (blue wave) support near $0.0000064.
The post Pepe’s Bullish Rally Forms Bullish Pattern, Traders Remain Optimistic appeared first on CoinChapter.
25d ago•
bullish:
0
bearish:
0
Share


 Manage all your crypto, NFT and DeFi from one place
Securely connect the portfolio you’re using to start.

bullish:
0
bearish:
0

bullish:
1
bearish:
0

bullish:
0
bearish:
0

bullish:
0
bearish:
0