Worldcoin (WLD) Bearish Trend: Analyzing Data to Decipher Price Action
26d ago•

bullish:
0
bearish:
0
Share

Worldcoin (WLD) is currently navigating a challenging market environment. Despite a significant price surge in early 2024, WLD has faced a persistent downward trend, failing to penetrate the daily Ichimoku Cloud, which signals a bearish sentiment.
Worldcoin has been quite a rollercoaster ride lately! The price skyrocketed in early 2024, peaking at around $11.50 in mid-February. But since then, it’s been on a bit of a downward slide.
WLD Fails to Reverse the Daily Bearish Trend
Let’s examine the price movements of WLD/USDT more closely and analyze some key technical indicators.
- Analyzing the price movements of WLD/USDT: We can observe key technical indicators that shed light on the current market sentiment. The Ichimoku Cloud, a significant technical indicator, provides resistance around the $5.50 mark (Tenkan Plateau). This cloud is currently red, indicating a bearish sentiment for Worldcoin.
- The support and resistance levels are crucial in understanding price action: The significant support level for WLD is $3.955, which has been tested multiple times since mid-March 2024. On the other hand, the key resistance level is at $5.50, where the price of Worldcoin has faced multiple rejections.
- Examining the price movements: WLD surged in January 2024, reaching around $11.50 by mid-February. However, since then, the price has been on a downward trend. There have been intermittent bullish attempts, but they have consistently failed to break through the $5.50 resistance level.
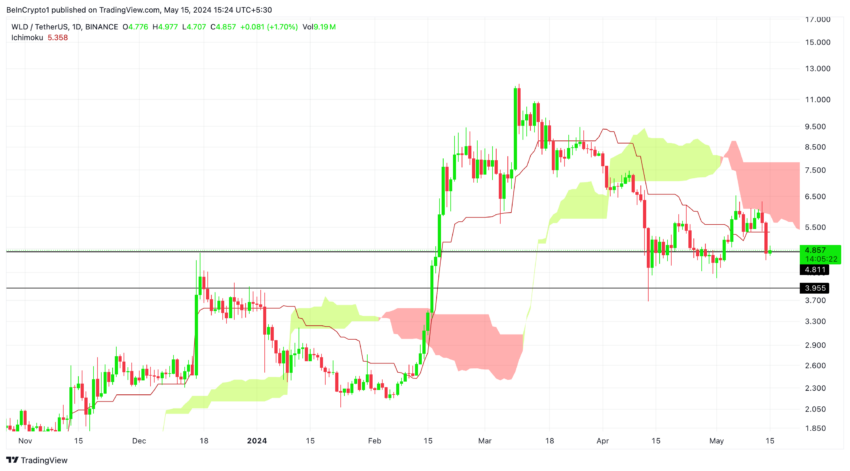 WLD/USDT (1D) Price Action. Source: TradingView
Analysis of Address Activity by Time Held
Analyzing the Address Activity by Time Held chart from IntoTheBlock provides valuable insights into the behavior of Worldcoin (WLD) holders based on how long they have held their assets.
Represented by the orange line, traders holding WLD for less than a month have shown significant activity. The number of trader addresses surged dramatically around mid-January 2024, surpassing the price.
This indicates a period of heightened speculative trading and short-term interest. As the price started to decline, the number of trader addresses also decreased, reflecting the exit of short-term speculators.
Read More: How to Buy Worldcoin (WLD) and Everything You Need to Know
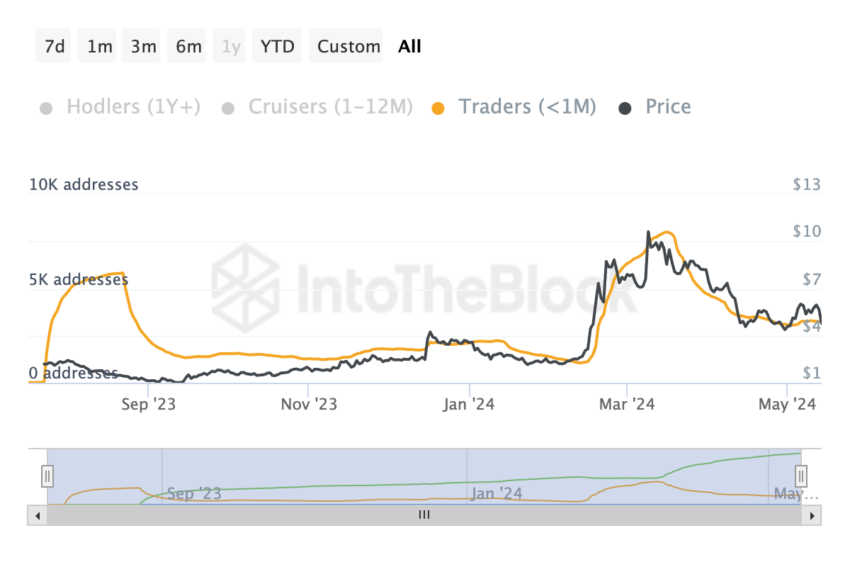 Address Activity by Time Held. Source: IntoTheBlock
The correlation between the number of short-term trader addresses and WLD’s price is evident. The influx of traders contributed to the sharp price increase. Still, as the price started to decline, these traders quickly exited, leading to a reduction in trader addresses and further pressure on the price.
This pattern suggests that short-term speculative trading heavily influences WLD’s price movements. For sustained growth and stability, WLD needs to attract long-term holders who believe in the project’s long-term potential.
The price is highly volatile and susceptible to rapid changes based on market sentiment due to the reliance on short-term traders. Traders should be cautious and consider the implications of this high volatility when making investment decisions.
How Active Address Data Reveals Worldcoin (WLD) Profitability Trends
Let’s break down the profitability of Worldcoin (WLD) active addresses using a chart from IntoTheBlock, which gives us a snapshot of the market’s health and sentiment.
- The green area on the chart shows addresses currently making a profit. Around January 2024, there was a significant increase in profitable addresses, coinciding with a sharp rise in WLD’s price. This means many addresses bought WLD at lower prices and benefited from the price surge.
- The grey area represents addresses that are breaking even. This segment has remained relatively stable, indicating that many holders are neither gaining nor losing significantly.
- The red area shows addresses that are currently experiencing losses. Most addresses have been out of profit since early 2024, especially after the price decline in mid-February. This indicates many holders bought at higher prices and are now experiencing losses, which could lead to increased selling pressure if the price doesn’t recover.
26d ago•
bullish:
0
bearish:
0
Share

 Manage all your crypto, NFT and DeFi from one place
Securely connect the portfolio you’re using to start.

bullish:
0
bearish:
0

bullish:
0
bearish:
0

bullish:
0
bearish:
0

bullish:
1
bearish:
0