
Hyperliquid Price Prediction: Whale Buys $8.6M as $HYPE Hits New ATH

0
0
Hyperliquid price prediction searches usually start with what the platform actually does.
Hyperliquid is a decentralized exchange built for perpetual futures trading, running on its own high-speed blockchain rather than sitting on top of an existing one.
Its native token, HYPE, has climbed fast since launch and now ranks #9 by market capitalization. $HYPE trades at $87.00, up 6.2% over the past 24 hours.
That puts Hyperliquid's market capitalization at $19.352 billion, with a circulating supply of roughly 222.4 million tokens out of a 1 billion max supply.
Live Market Data
| Metric | Value |
| Price | $87.00 |
| 24h Change | +6.2% |
| 24h Range | $81.74 – $88.06 |
| Market Cap | $19.352B |
| Fully Diluted Valuation | $83.109B |
| 24h Trading Volume | $1.604B |
| Total Value Locked | $6.785B |
| Circulating Supply | 222.446M HYPE |
| Total Supply | 955.307M |
| Max Supply | 1B |
| Total Treasury Holding | 19,724,727 |
Hyperliquid Liquidation Snapshot
The last hour was almost entirely a short story: $7.50K in total liquidations, with $7.29K of that from shorts and just $206.88 from longs. Four hours out, the gap widens further.
Total liquidations hit $852.09K, and shorts made up $795.77K of it against $56.31K in longs. 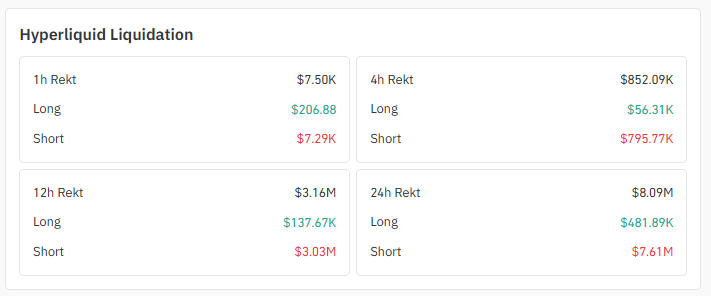
Source: Liquidation Data Taken From CoinGlass, As of Sep 4, 2026
The 12-hour window shows $3.16M liquidated, with shorts again dominant at $3.03M versus $137.67K in longs.
Across the full day, total liquidations reached $8.09M, and shorts accounted for $7.61M of that compared to $481.89K in longs.
This kind of lopsided pattern, repeated across every timeframe, points to short sellers getting squeezed hard as HYPE pushed toward new highs.
Hyperliquid Exchange Volume
Futures activity for HYPE is spread across a wide set of venues.
Binance leads with $1.12B in 24-hour futures volume, followed by its own Hyperliquid platform at $760.84M and LBank at $713.95M. OKX recorded $487.61M, Bybit posted $395.22M, and MEXC logged $189.96M. 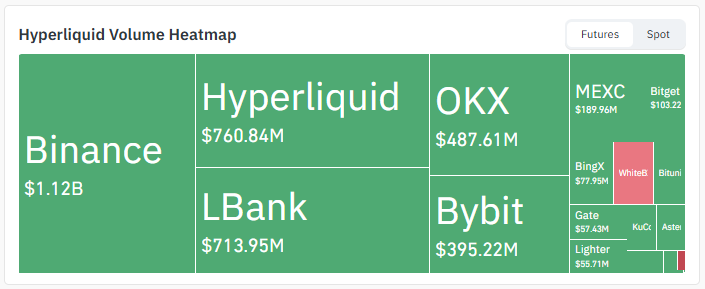
Source: Volume Heatmap Data Taken From CoinGlass, As of Sep 4, 2026
Bitget contributed $103.22M, BingX added $77.95M, and smaller volumes came from WhiteBIT, Gate, KuCoin, Lighter, and Aster.
This spread across both centralized exchanges and Hyperliquid's own book reflects the token's dual identity as both a trading asset and the governance token of an active derivatives platform.
Hyperliquid News
As per Ted (@TedPillows): A whale just bought $8,600,000 in $HYPE Accumulation.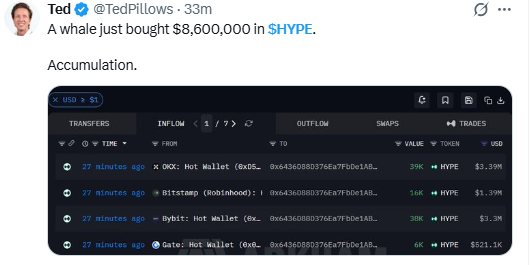
Source: Data Taken From @TedPillows, X Account, As of Sep 04, 2026
Why it matters: On-chain data behind the tweet shows the buying spread across several hot wallets in quick succession, roughly $3.39M routed through OKX, $3.3M through Bybit, $1.39M through Bitstamp, and $521.1K through Gate, all within about 27 minutes of each other.
A purchase of this size, executed quickly across multiple venues, is typically read as a sign of conviction buying rather than routine trading.
Coming alongside the heavy short liquidations noted above, this kind of accumulation adds another data point suggesting demand has been outpacing supply during the recent move higher.
Hyperliquid Price Prediction: Technical Analysis
The 4-hour HYPE/USDT chart on OKX shows price climbing inside a well-defined ascending channel, with both boundaries sloping upward since late August. 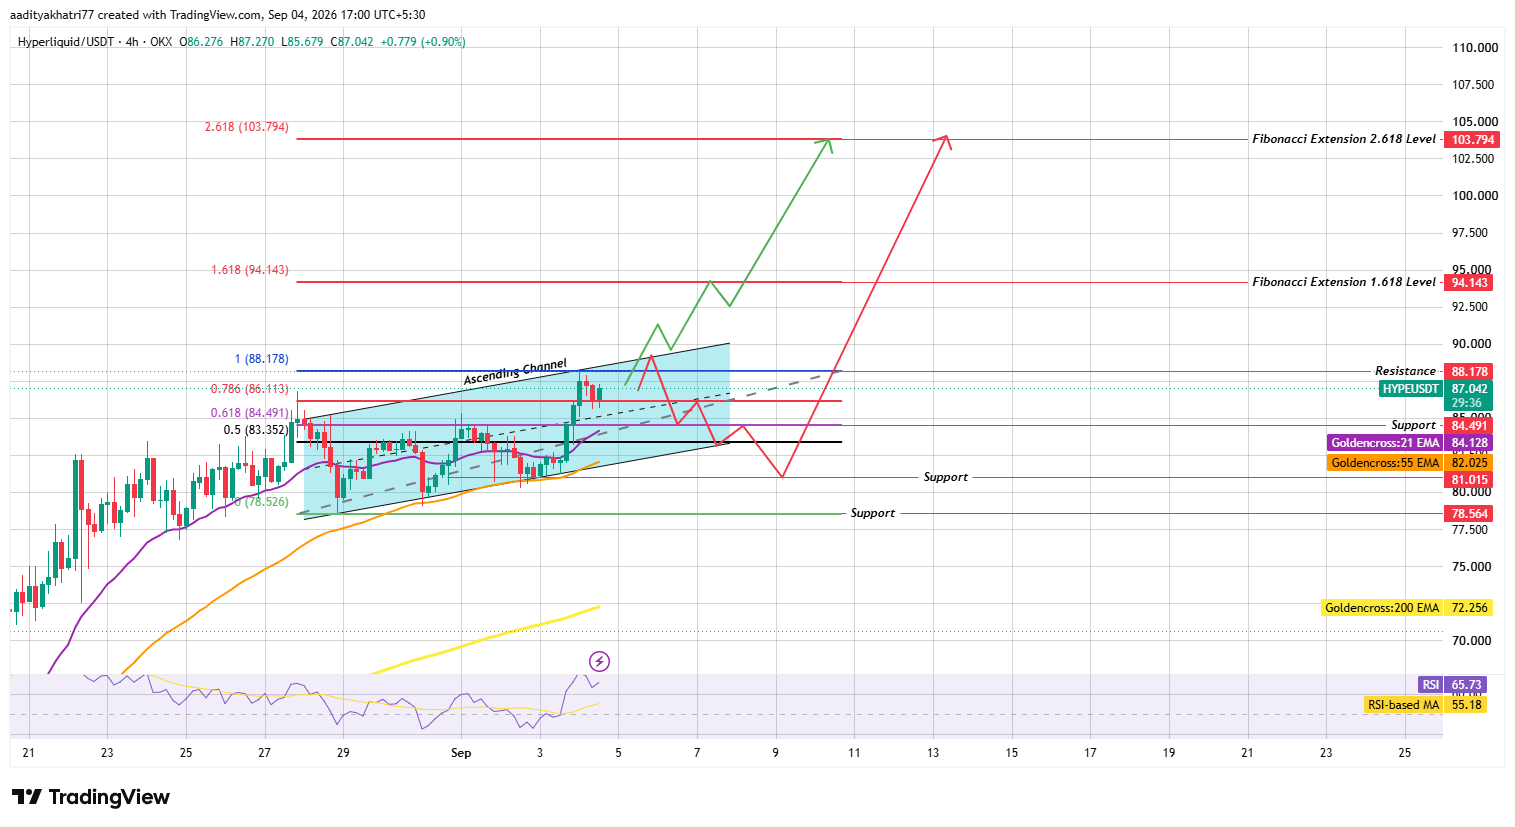
Source: Chart Taken From TradingView, As of Sep 4, 2026
$HYPE is now testing the top of that channel, right around the $88.18 resistance level, and is trading above all three key EMAs while pushing toward fresh all-time highs.
Hyperliquid Support and Resistance Levels (4H Chart)
| Level Type | Price |
| 2.618 Extension | $103.79 |
| 1.618 Extension | $94.14 |
| Resistance 1 | $88.18 |
| Support 1 | $84.49 |
| Support 2 | $81.02 |
| Support 3 | $78.56 |
Hyperliquid EMA Levels (4H Chart)
| EMA | Value | Price Position |
| 21 EMA | $84.13 | Price trading above |
| 55 EMA | $82.03 | Price trading above |
| 200 EMA | $72.26 | Price trading above |
Can HYPE Break Toward New Fibonacci Highs?
A bounce from the current zone that clears both the $88.18 resistance and the channel's upper boundary, backed by rising volume, would put the 1.618 Fibonacci extension at $94.14 in play.
Beyond that, the 2.618 extension at $103.79 becomes the next target if momentum holds.
What Happens If HYPE Gets Rejected at Resistance?
If the price is rejected at $88.18, the first pullback level is the $84.49 support. Should that bounce fail to hold, $HYPE risks a slide toward $81.02, and a break below that would open the door to $78.56.
RSI sits at 65.73, with its moving average at 55.18, showing strong bullish momentum without being deeply overbought.
This leaves some room for the breakout attempt to continue before conditions turn stretched.
Hyperliquid Price Prediction: Bull, Base, and Bear Scenarios
| Scenario | Setup | Level |
| Bull Case | Break above resistance and the channel's upper boundary with strong volume. | $94.14 (1.618 Fib extension), extended target $103.79 (2.618 Fib extension) |
| Base Case | Price continues moving inside the ascending channel without a clear break. | Range-bound trade between support and resistance |
| Bear Case | Rejection at resistance, followed by a failed bounce at support | $81.02, deeper breakdown toward $78.56 |
Glossary
Ascending Channel: a pattern formed by two parallel upward-sloping trendlines, with price moving between the boundaries as the broader trend continues higher.
Fibonacci Extension: a technical tool that projects potential price Levels beyond a prior move, based on ratios like 1.618 and 2.618 drawn from the Fibonacci sequence.
EMA (Exponential Moving Average) weights recent price data more heavily than older data, so it reacts faster than a simple moving average.
All-Time High (ATH) : the highest price an asset has ever traded at, often watched closely since a price above this level has no prior resistance to reference.
Liquidation is what happens when a leveraged position gets forcibly closed because losses have eaten through the trader's margin.
RSI (Relative Strength Index) scores momentum from 0 to 100 based on how fast and how far price has moved. High readings flag overbought conditions; low ones flag oversold.
Hyperliquid vs Bitcoin
HYPE's push toward new highs has come even as Bitcoin has traded in a relatively steady range, suggesting this move is being driven largely by Hyperliquid-specific factors like the whale accumulation and strong platform volume rather than broad market momentum.
Bitcoin price today sits near $81,000, and while its direction still shapes overall risk appetite across crypto, $HYPE's independent strength points to demand tied directly to the Hyperliquid platform itself.
A stable Bitcoin backdrop would likely keep conditions favorable for HYPE's breakout attempt, while a sharp Bitcoin downturn could still pull $HYPE back toward its support levels regardless of its own momentum.
Expert Opinion
Commentary around Hyperliquid has increasingly focused on the platform's growing trading volume and the token's push into uncharted price territory.
Analysts tracking the token note that large, fast wallet-to-wallet accumulation, like the $8.6 million purchase highlighted this week, often precedes continued strength when paired with heavy short liquidations on the way up.
Near-term price direction is still expected to hinge on whether HYPE can clear the $88.18 resistance and the ascending channel's upper boundary on strong volume.
Disclaimer: This article is written for informational purposes only and isn't financial advice. Crypto markets, including Hyperliquid (HYPE), are volatile, and prices can swing sharply in either direction over short periods. The bull, base, and bear scenarios above are technical projections drawn from available chart data, not guarantees of what actually happens. HYPE could fail to reach any of the Fibonacci extensions levels discussed or could decline well below the support levels listed, particularly if broader market sentiment turns down. Readers should conduct their own research and consult a qualified financial advisor before making investment decisions.
0
0

 Manage all your crypto, NFT and DeFi from one place
Securely connect the portfolio you’re using to start.


