
Raydium price prediction: Can Real DEX Revenue Extend the Rally?

0
0
Most token rallies run on sentiment alone. Raydium's current move has something extra: an actual DEX generating real fees and billions in monthly volume.
This Raydium price prediction checks whether that fundamental backing can carry $RAY past its next resistance test.
What Is RAY Trading At and What Does the DEX Actually Earn?
According to Coinglass, $RAY trades near $1.78, up 6.24% in 24 hours despite a small 1.45% dip over the last four hours.
The $RAY market cap sits around $476 million, with 269.73 million tokens circulating against a maximum supply of 555 million.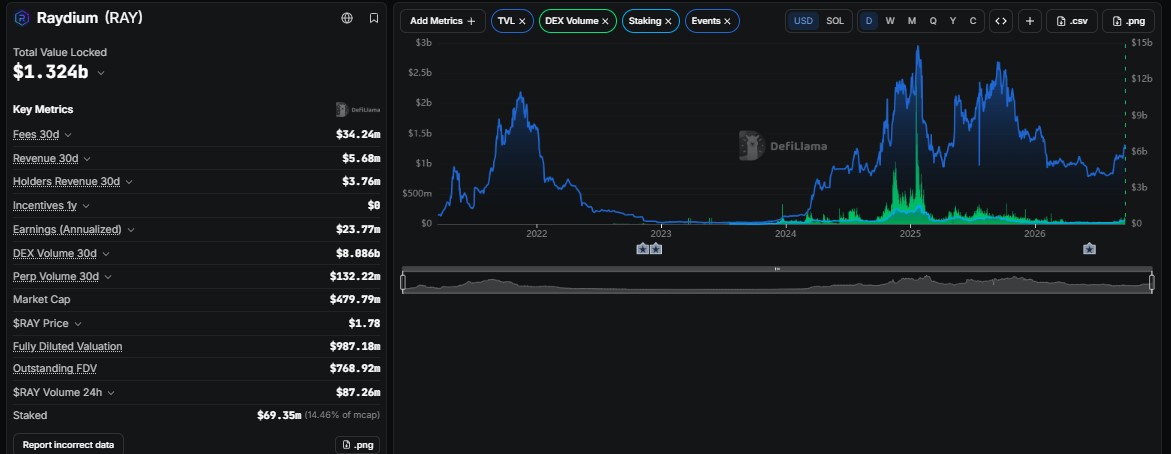
Behind the price, DefiLlama shows Raydium carrying $1.324 billion in total value locked, $34.24 million in fees and $5.68 million in revenue over the last 30 days, with $8.086 billion in DEX volume over the same period.
A fully diluted valuation near $987 million against a market cap under $480 million shows future token unlocks are still being priced in.
How Strong Has the RAY Price Run Actually Been?
Coinglass performance data paints a two-speed picture. Short- and medium-term gains are sharp, with $RAY up 27.38% over seven days, 137.72% over 30 days, and 195.34% over 90 days.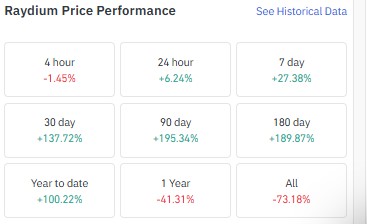
The one-year figure still reads 41.31% lower, though, and the all-time change sits at negative 73.18%, so today's strength is a recovery phase, not a return to old highs.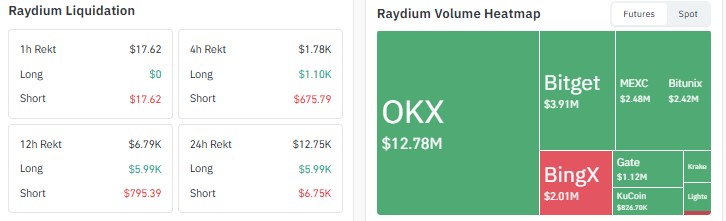
$RAY liquidations stayed light and fairly balanced over 24 hours, at $6.75K on the short side against $5.99K on the long side, not a crowded, one-sided market.
Is RAY Open Interest Backing the Move?
RAY open interest stands at $22.93 million per Coinglass, after a sharp spike toward the high-$20 million range earlier this week that has since eased back.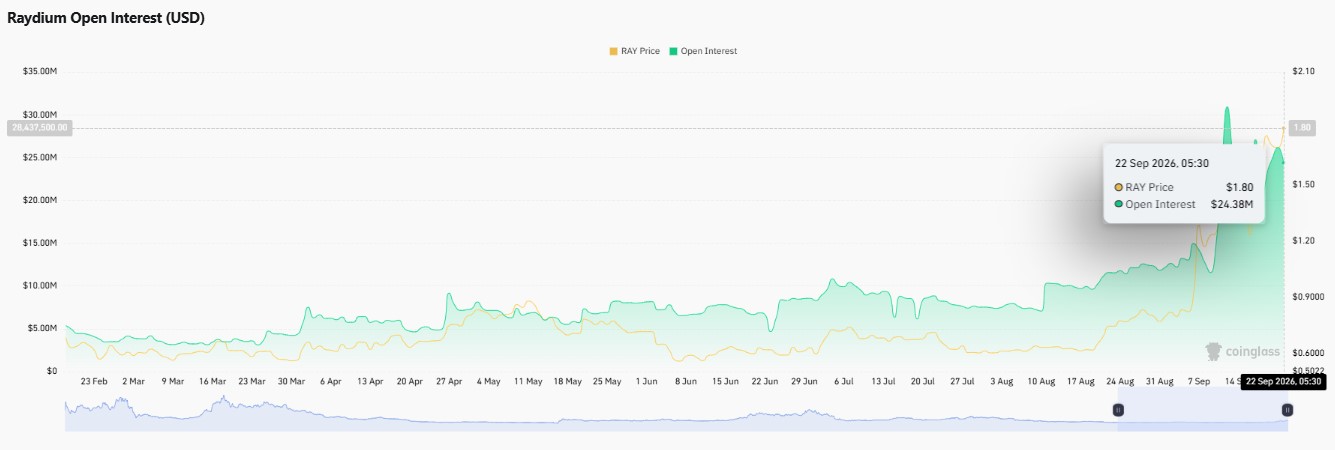
Open interest holding well above its earlier 2026 base while price keeps most of its gains suggests real capital, not just fading leverage, is behind the move.
What Do Fees, Staking and TVL Say About Real Demand for RAY?
Of the $5.68 million in 30-day revenue, $3.76 million flows to holders, and the protocol's annualized earnings run near $23.77 million with no token incentives paid out over the past year, according to DefiLlama.
Roughly $69.35 million of RAY, about 14.46% of market cap, sits staked.
A DEX passing most of its fees to holders without inflationary incentives is a different setup from tokens rallying on narrative alone.
Is RAY's Golden Cross Still Holding on the 4H Chart?
Per TradingView chart data for RAY/USD on Coinbase, price has been trading above its golden cross since early September, with the 50 EMA at 1.6032 sitting well under the 200 EMA at 1.2199, both comfortably below the current price near 1.77.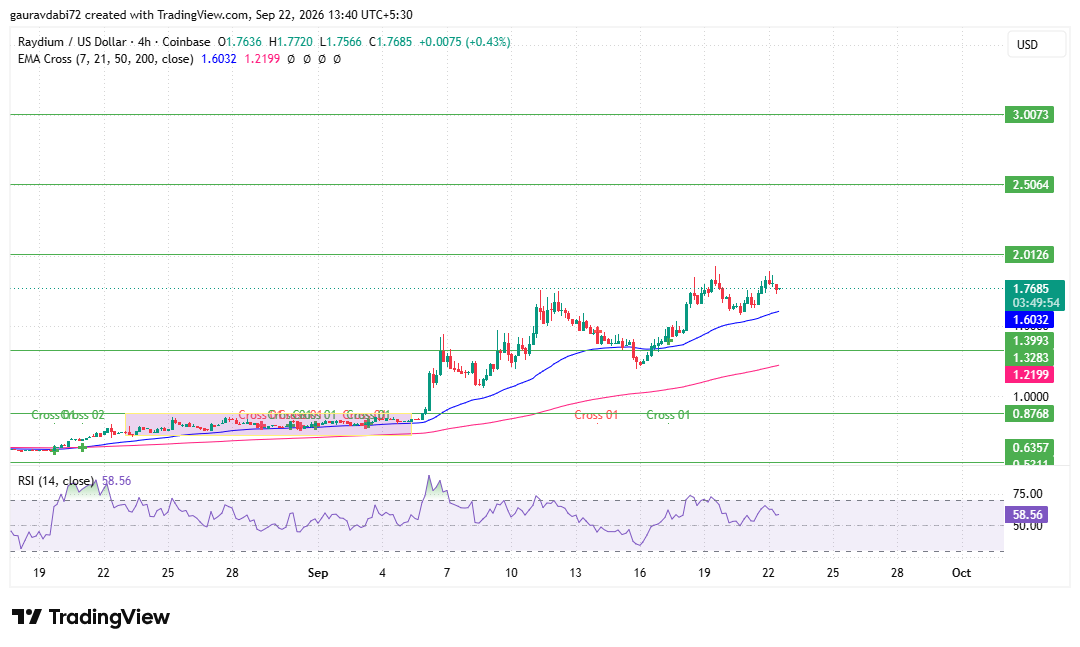
RSI (14) reads a neutral 58.56, a contrast to the overbought readings on some recent breakouts, suggesting room to run before momentum stretches.
What Are the Next RAY Resistance and Support Levels?
If buyers keep control above the golden cross, the levels to clear are 2.0126, then 2.5064 and 3.0073.
On the downside, 1.3283 is the first meaningful support below current price, with 0.8768 and 0.6357 as deeper floors if the broader uptrend were to break down, though the golden cross zone would need to break first for those to come into serious play.
Can RAY Clear 2.0126 With Fundamentals in Its Favor?
The Raydium price prediction here leans on charts and cash flow together.
A neutral RSI, an intact golden cross, and real protocol revenue build a more durable case for testing 2.0126 than momentum alone.
Scenario | Trigger | Key Levels |
Bullish | Price holds the golden cross and clears 2.0126 with buyer support. | 2.5064, then 3.0073 |
Neutral | Price consolidates between the EMAs and 2.0126 while RSI builds. | Range between 1.6032 and 2.0126 |
Bearish | The golden cross structure breaks, and the price falls below 1.3283. | 1.3283, then 0.8768 and 0.6357 |
Where Could This Setup Go Wrong?
The clearest risk sits in the FDV gap, since $987 million in fully diluted valuation against under $480 million in market cap means further tokens are still due to enter circulation over time, which can weigh on price independent of chart structure.
The token also remains far below its all-time levels, a reminder that past cycles have punished RAY holders severely.
How Does the Analyst Desk View This Setup?
The CoinGabbar analyst desk sees RAY as one of the more fundamentally backed setups on the board, with real DEX revenue, majority-to-holder fee distribution, and a neutral RSI all supporting further upside.
The caveat is simple: a close below 1.3283 would undercut the golden cross structure, and that matters more than any single day's move.
Bottom Line on the Raydium price prediction
Raydium's setup stands out for pairing technical strength with an operating business generating real fees.
As long as the price holds above its golden cross, 2.0126 remains the level to watch, with 2.5064 and 3.0073 next if buyers keep showing up.
A break under 1.3283 would be the clearest signal that this recovery needs more time.
Disclaimer: This article is for informational purposes only and is not financial, investment, or trading advice. Crypto prices are highly volatile, so readers should assess their own risk before making any decision.
0
0

 Manage all your crypto, NFT and DeFi from one place
Securely connect the portfolio you’re using to start.


