Daily Market Review: BTC, ETH, SOL, ARB, APT
14d ago•

bullish:
0
bearish:
0
Share

Today’s market session has seen bulls and bears struggle for control, as seen in the increase in the global market cap. The total cap has seen a 2.23% drop over the last 24 hours to stand at $2.25T as of press time, while the trading volume dropped by 17% over the same period to stand at $77.38T as of press time.
Bitcoin Price Analysis
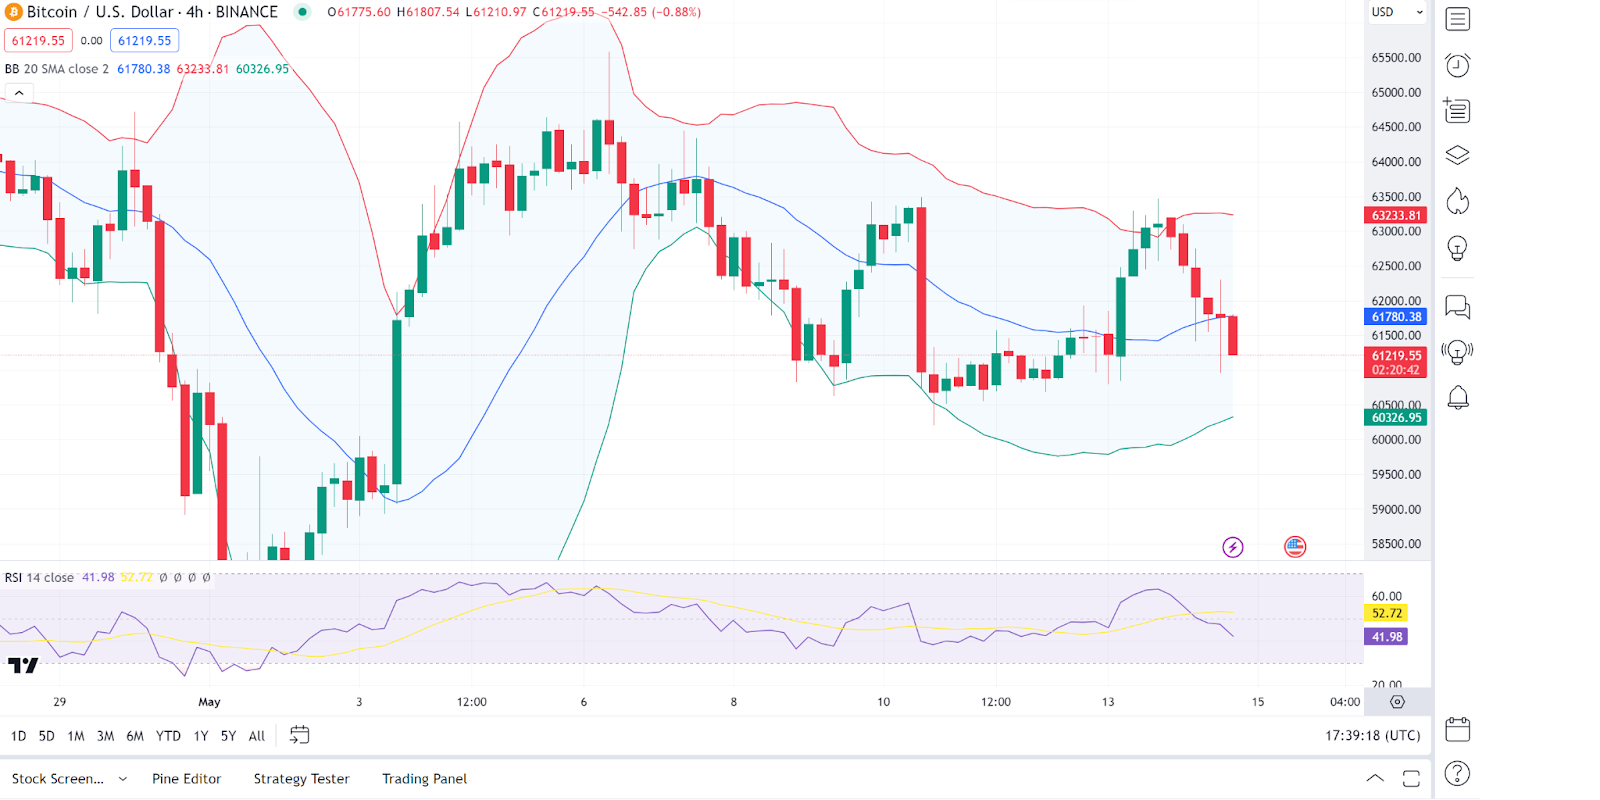
Bitcoin’s (BTC) price movements show it failed to register gains in today’s session. An in-depth analysis shows that the Bitcoin price fluctuates around the lower band, indicating a bearish trend with potential increased volatility. The Bitcoin price is below both the 20-period SMA (blue line) and the 200-period SMA (green line), confirming the bearish momentum.
On the other hand, the Relative Strength Index (RSI 14) is near 42, suggesting that the market is neither oversold nor overbought but is leaning towards bearish conditions. As of press time, the Bitcoin price stood at $61,333, a 2.1% increase from its previous 24-hour price.
Ethereum Price Review
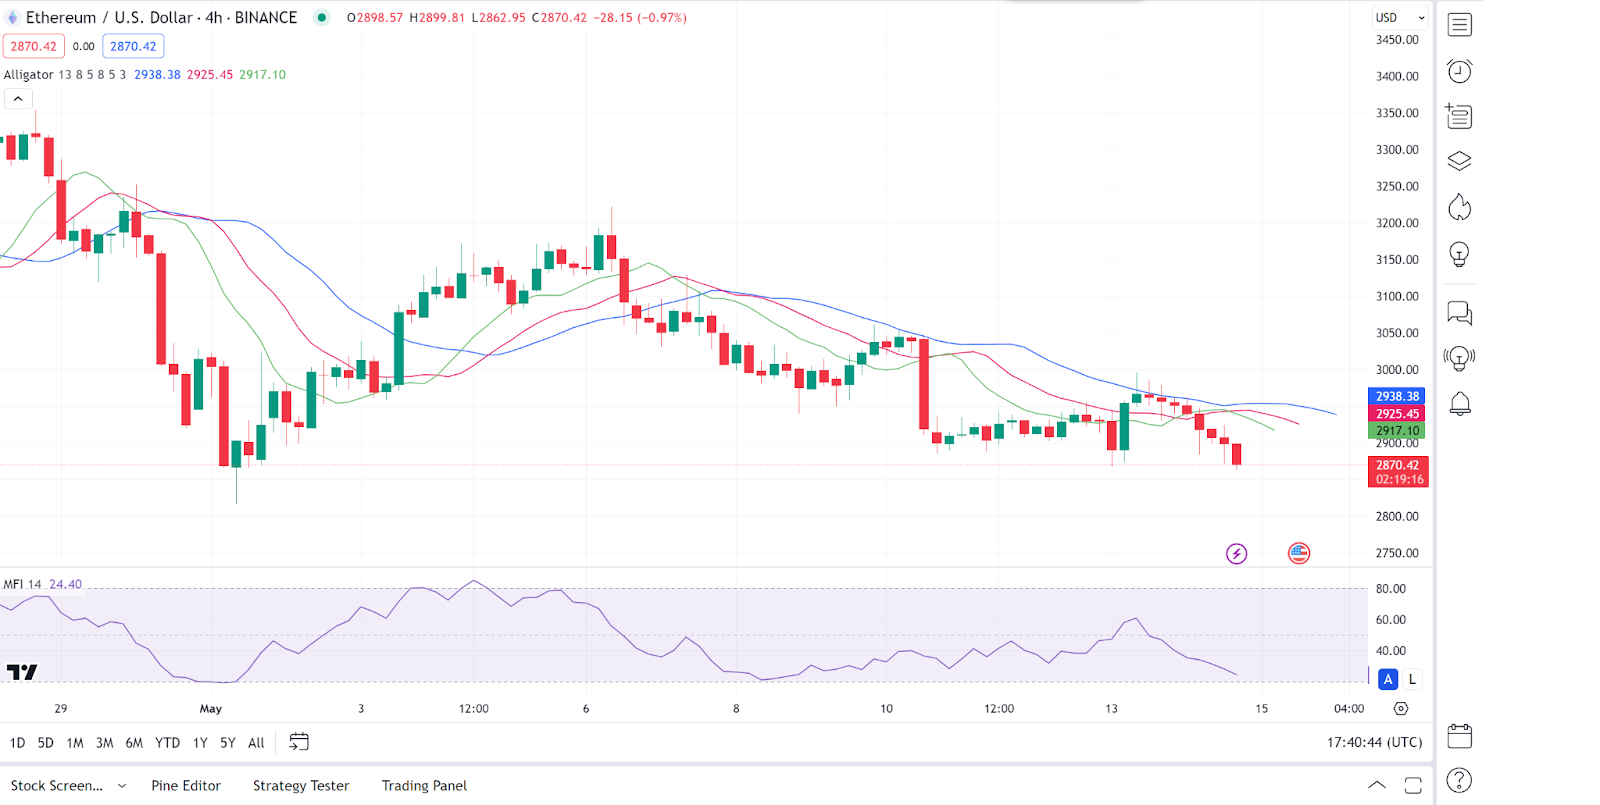
Ethereum (ETH) is also having a bear session, as evidenced by its price movements today. In-depth analysis shows that the jaw (blue), teeth (red), and lips (green) are intertwined and moving downwards, indicating a bearish phase with possible continuation.
On the other hand, the Money Flow Index (MFI) is around 24, which is quite low and suggests potential overselling. As of press time, the Ethereum price stood at $2,872, a 2.1% decrease from its previous 24-hour price.
Solana Price Review
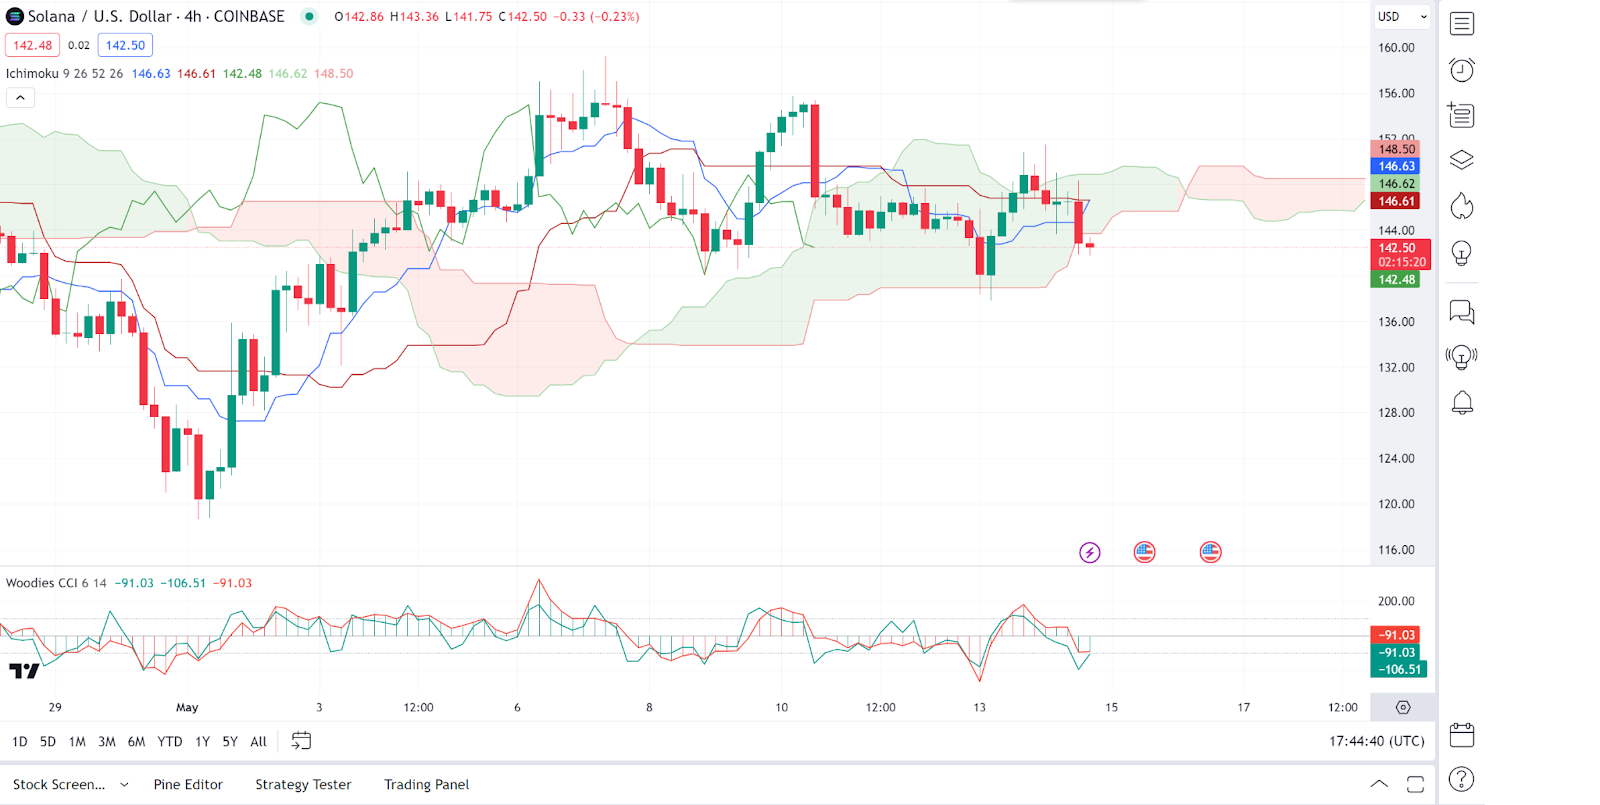
Solana (SOL) is another gainer in today’s session, as evidenced by today’s session. Looking at an in-depth analysis, we see that the Solana price trades within the Ichimoku cloud, suggesting a lack of a clear trend with possible consolidation.
On the other hand, the CCI (Commodity Channel Index) fluctuates around the zero line, confirming the market’s indecision. As of press time, the Solana price stood at $143.55, a 1.8% increase from its previous 24-hour price.
Arbitrum Price Review
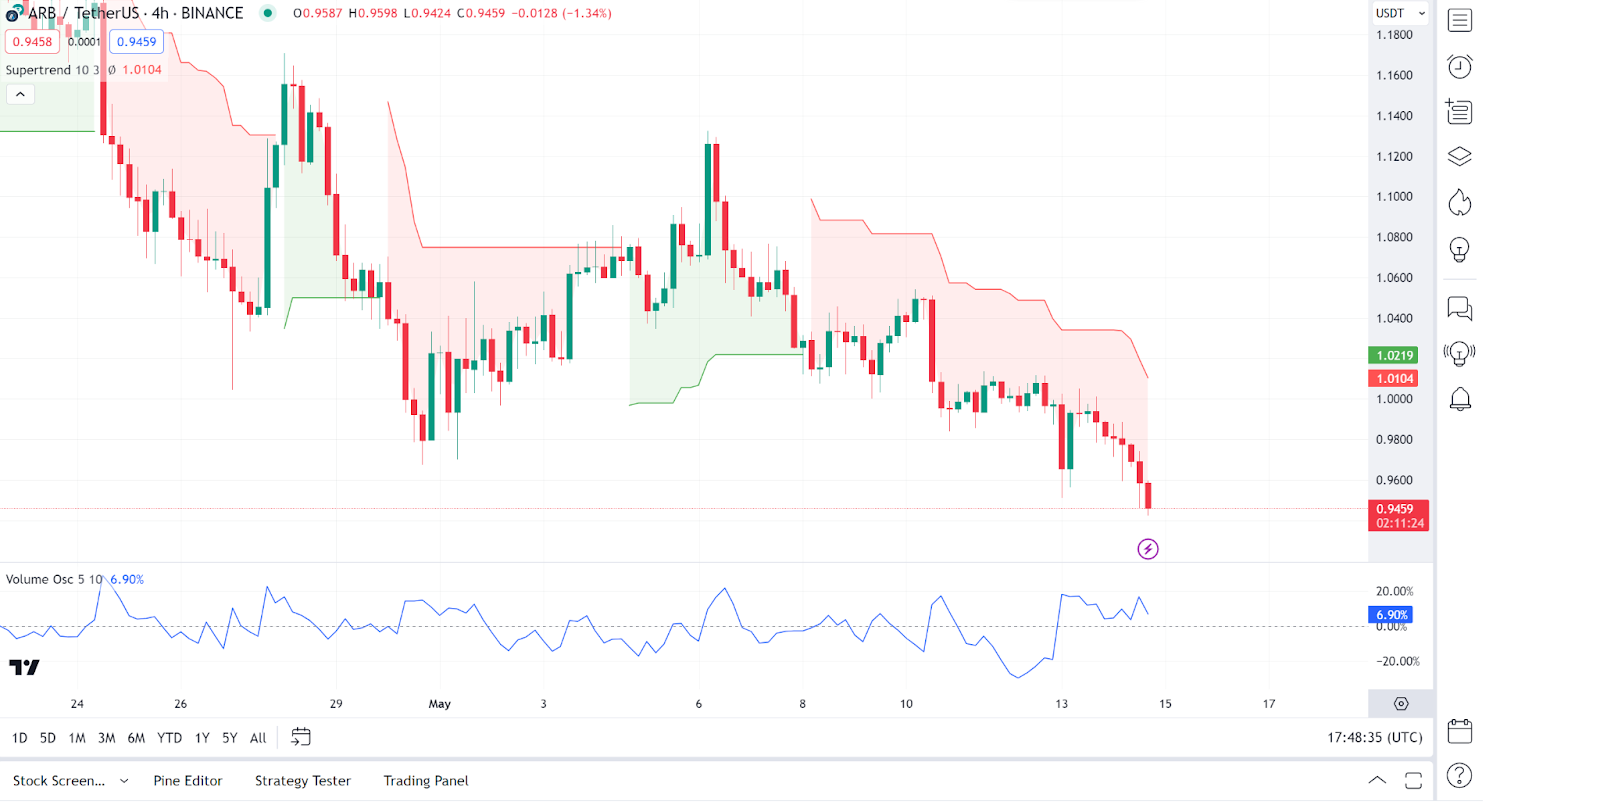
Arbitrum (ARB) is another gainer in today’s session, as seen from its price movements. However, according to an in-depth analysis, the Arbitrum price is below the SuperTrend line, signaling a bearish trend.
On the other hand, the Volume Oscillator shows a slight decrease in volume, suggesting a decrease in momentum. As of press time, the Arbitrum price stood at $0.9501, a 3% increase from its previous 24-hour price.
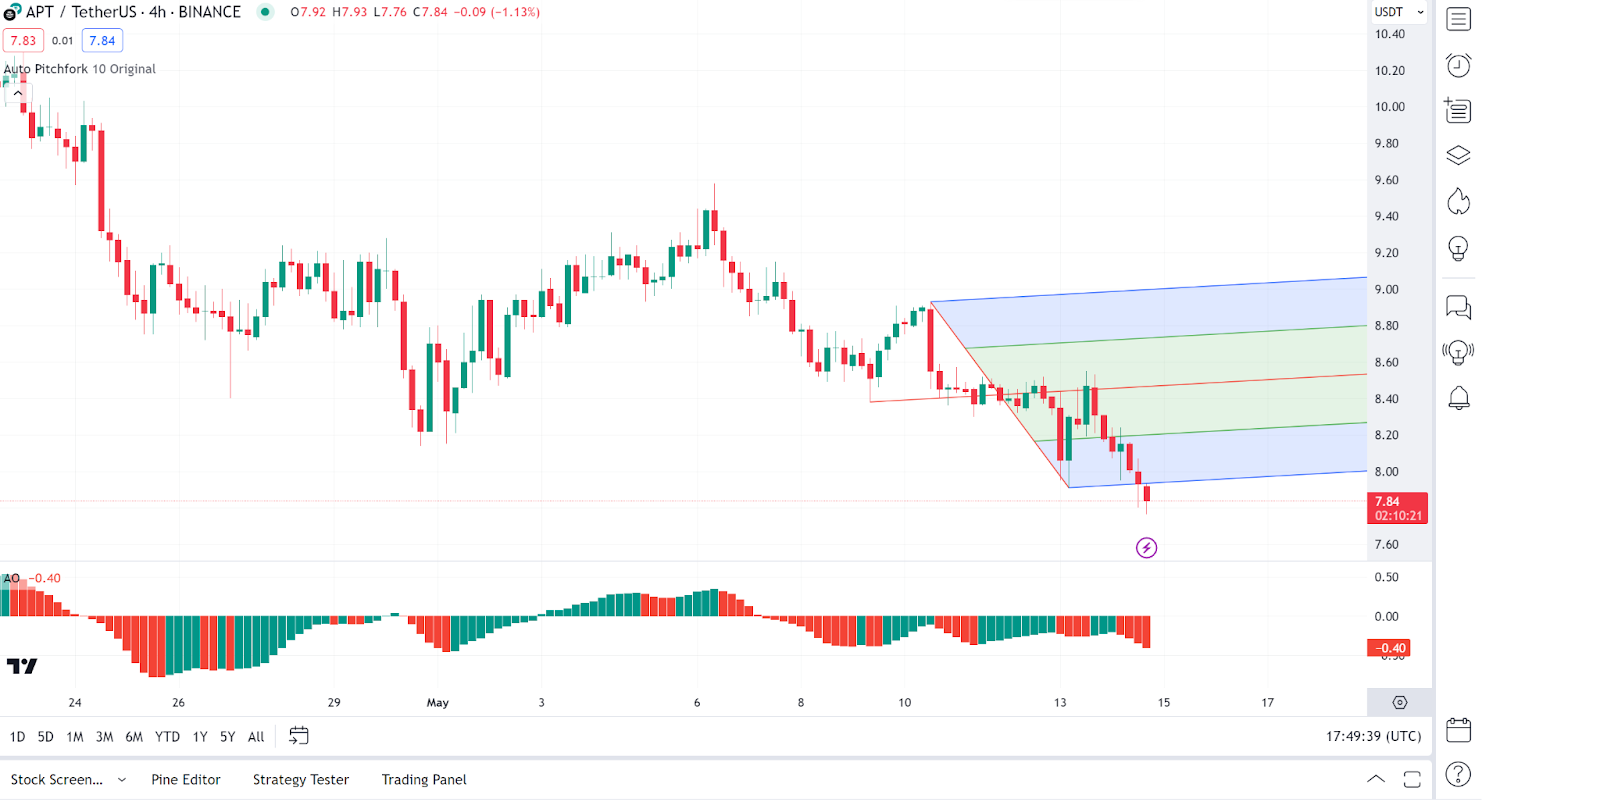
Aptos Price Review
As its price movements show, Aptos (APT) is another gainer in today’s session. The Aptos price is in the lower region of the pitchfork, indicating that the price is under pressure and may continue to decrease if it stays below the median line.
On the other hand, the MACD is below zero and shows red histograms, which further supports the bearish sentiment. As of press time, the Aptos price stood at $7.85, a 4.46% increase from its previous 24-hour price.
14d ago•
bullish:
0
bearish:
0
Share
 Manage all your crypto, NFT and DeFi from one place
Securely connect the portfolio you’re using to start.

bullish:
0
bearish:
0

bullish:
0
bearish:
0

bullish:
0
bearish:
0

bullish:
0
bearish:
0