
Quant Price Prediction: QNT Falls to $236, the Level That Decides

0
0

Quant (QNT) was trading at around $236 late on Friday evening, October 2, 2026 (according to CoinGecko). That is a loss of almost 18 percent against the closing price of $287 on September 30, and still about three and a half times the level of mid-September. Over the past 24 hours the range ran between $224.80 and $261.29. For the Quant price prediction, one question is therefore decisive: does the zone around $225 to $230 hold, or does the correction run on?
What Is Behind the Run From $66 to $287
QNT closed at $65.70 on September 19 and at $287.38 on September 30 (daily closing prices, CoinMarketCap). Over 30 days that is a gain of roughly 264 percent, over seven days of almost 140 percent. Among the 50 largest crypto assets it is the strongest advance over 30 days, well ahead of NEAR at around 149 percent (CoinGecko, October 2).
The trigger came from the US banking sector. The Clearing House, operator of the RTP and CHIPS payment systems and owned by large US banks, selected Quant on September 24 as technology partner for a network of tokenised deposits, as Blockonomi reports. Quant is to run the layer that coordinates settlement and clearing between the banks and connects the network to RTP and CHIPS. Two days later seven British banks, among them Barclays, HSBC and Lloyds, reported the first genuine customer payments in tokenised sterling deposits over the Quant platform (Cryptopolitan). We set out the background to the mandate in our piece on tokenised deposits.

One question has remained open, and for the price it weighs more than any headline: how many QNT tokens does the bank network need? The banks use the Overledger software. Neither Quant nor The Clearing House has put a figure on whether, or to what extent, tokens have to be bought or locked up for it, as KuCoin News also notes. The price is therefore discounting an expectation, not measured demand.
Quant Price Prediction: The Three Levels on the Chart
The one-year price history shows how unusual the past two weeks have been. For months QNT moved between $55 and $100, and the 200-day average ran flat between $70 and $80. Only the jump from September 25 pulled both moving averages upwards.
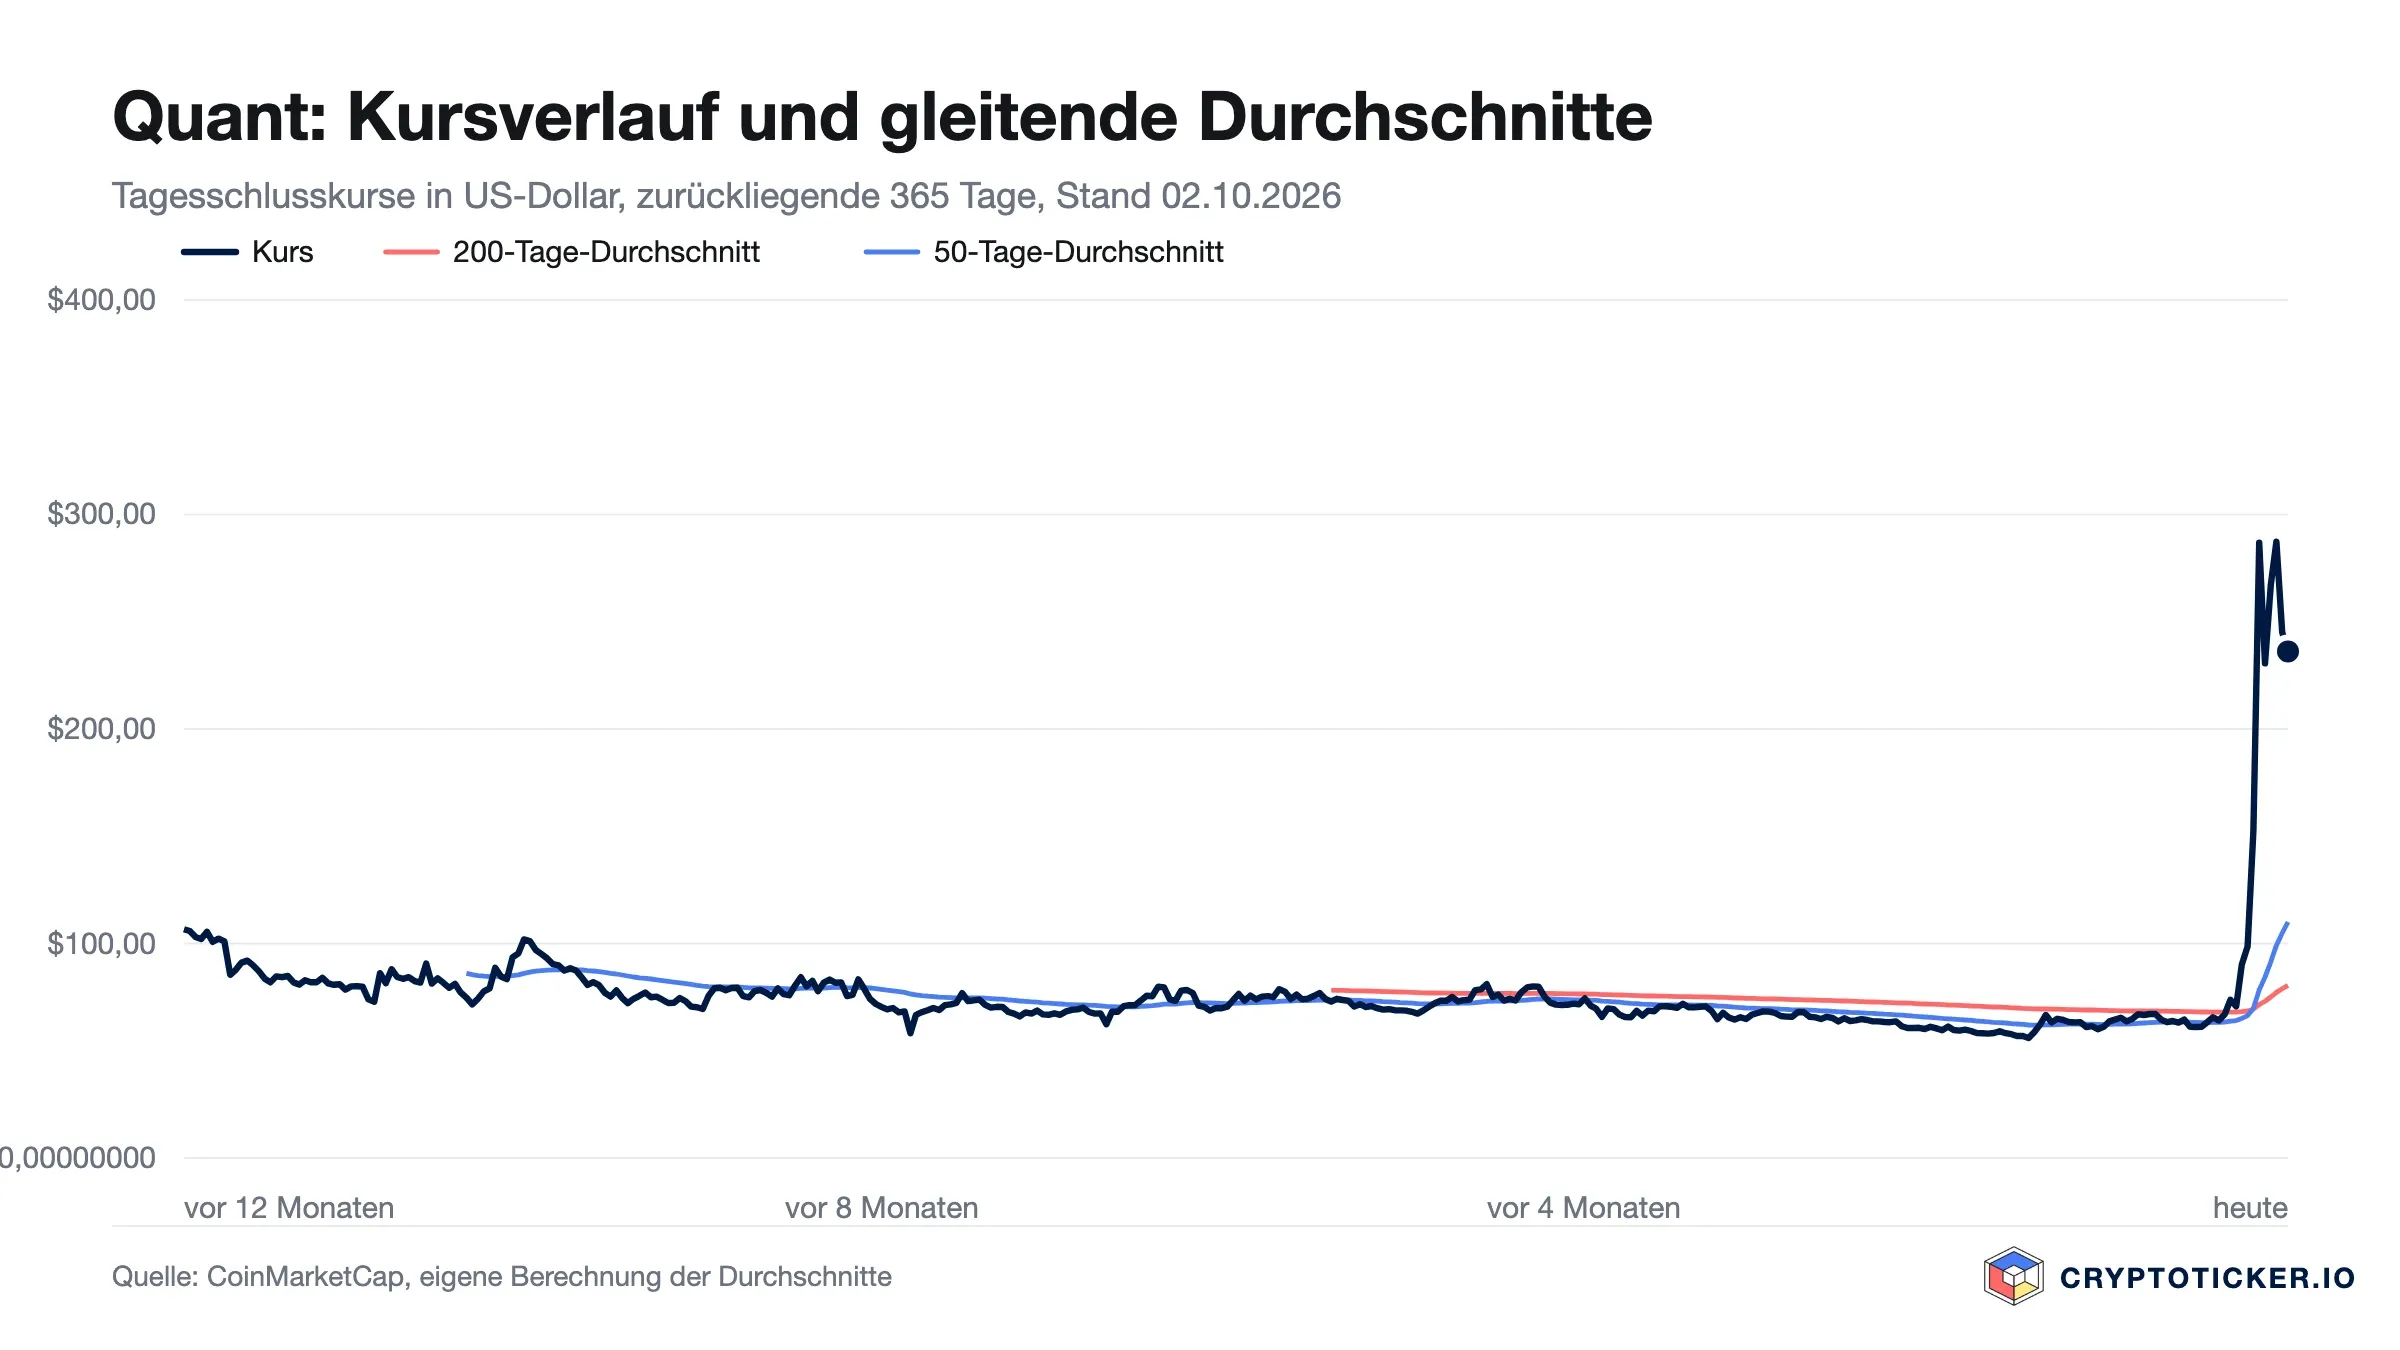
$225 to $230 is the first level on the downside. This is where the daily low sat on October 2 ($224.80), and this is where QNT closed on September 28 ($230.60), when the price had already given back ground sharply after its first high. Intraday QNT did slip to around $195 that day, but on a closing basis the token has not fallen below $230 since September 27.
$287 is the level on the upside, the highest daily close of the run, set on September 30. Intraday the high was far above it: on September 27 QNT reached around $373 on the Binance spot market, as we described in our article on shorting Quant. Only a close above $287 would show that the buyers are back.
Around $155 is the zone below. That is where QNT closed on September 26, and that is where the 20-day average stood on October 1 ($155.61, according to The Cryptonomist). Between $225 and $155 there is not a single closing price at which a floor could have formed.
Why Quant Remains So Volatile
The daily RSI stood at 81 on October 1, and the average daily range (ATR) at $45.78 (The Cryptonomist). In other words: a day with 15 to 20 percent of movement is currently normal for QNT. On top of that comes leverage. Since the run began, OKX has offered QNT futures with up to 50 times leverage (crypto.news). At that kind of leverage a few percent are enough to force positions closed, and every forced closure amplifies the move.
Trading volume is still high. In the 24 hours to Friday evening, QNT worth around $408 million changed hands, against a market capitalisation of $3.44 billion (CoinGecko). A good tenth of the market value therefore turns over every day.
Quant vs Bitcoin: The Gap to the Market
While QNT gained almost 140 percent in seven days, Bitcoin managed barely one percent over the same period and trades at around $84,500 (CoinGecko). Quant’s run is therefore not a market move but a single story. That makes it strong for as long as news keeps coming, and vulnerable the moment things go quiet.

For the coming months the banks’ timetable is the yardstick. According to the reports around the launch, The Clearing House network is to open to participating institutions in the first half of 2027, and by early 2027 some 25 US banks are due to be connected. Every further bank, every test run with figures, can support the price. Until then, however, the calendar offers no fixed date against which the price can be measured.
Quant: The Key Points for Your Decision
Three points sum up the situation. First: as long as QNT closes above $225, the pullback is a pause after a steep climb. Second: if that zone goes, there is little support on the chart down to around $155. Third: the bank mandate is real, but how much of it reaches the token is open.
Anyone holding QNT or looking to buy should size their position against the current daily range, not against the run of the past weeks. QNT is tradable on several exchanges licensed under the European MiCA regulation, and the fees differ markedly, as our comparison of regulated crypto exchanges shows. An assessment of whether entering at the current price is worthwhile can be found in our analysis Is Quant a good buy at the current price?. Anyone who has taken profits out of the run should keep the holding period in mind: in Germany, coins held for less than a year are taxable on sale once the annual exemption limit of 1,000 euros is exceeded.
Crypto assets are highly volatile and a total loss is possible. This article places price levels and news in context; it is not a recommendation to buy or sell Quant.
(As of October 2, 2026. This article is not investment advice. Prices and fee structures change; check the terms with the provider before you buy.)
0
0

 Manage all your crypto, NFT and DeFi from one place
Securely connect the portfolio you’re using to start.


