
Dogecoin Price Prediction: Will $0.09117 Hold After a 10% Drop?

0
0

Dogecoin has dropped more than 10% in a single day, yet spot ETF products keep taking in fresh money.
That gap sets the tone for this Dogecoin price prediction and the wider Dogecoin price prediction September 2026 outlook.
The Dogecoin coin launched in December 2013 as a lighthearted take on the Shiba Inu meme, created by Billy Markus and Jackson Palmer.
It has since grown into one of the largest meme tokens and currently ranks 12th by market cap.
The Dogecoin price today is $0.09313, down 10.3% over the past 24 hours and 7.3% against Bitcoin. The 24-hour range runs from $0.09172 to $0.1042.
Trading volume stands at $1.791 billion, and market cap is $14.532 billion.
$DOGE Live Market Data
Metric | Value |
Price | $0.09313 |
24h Change | -10.3% |
24h Range | $0.09172 to $0.1042 |
Market Cap | $14.532B |
Fully Diluted Valuation | $14.532B |
24h Trading Volume | $1.791B |
Circulating Supply | 156.042B |
Total Supply | 156.043B |
Max Supply | Unlimited |
Total Treasury Holding | 802,235,229 |
Source: market data taken from CoinGecko, as of Sep 24, 2026. Figures may vary slightly across other tracking websites.
Dogecoin News Today: Spot ETF Inflows Rise
The latest Dogecoin news comes from BSCN, which reported that investors added $1.2M to spot DOGE ETFs.
The outlet said net inflows have already passed $2M this week and described the trend as a renewed interest in these products.
Source: Data Taken From @BSCNews, X Account, as of Sep 24, 2026
The scale is still small. The funds hold only 0.11% of the current $DOGE supply, so they cannot move price alone.
Some traders link inflows like these to DOGE whale accumulation, but the data reviewed here covers ETF flows only.
It does not confirm large wallet buying. Tracked treasury holdings of about 802.2 million DOGE are the only other large-holder figure available.
For anyone following Dogecoin news today, the direction matters more than the size. Money is arriving while the price falls.
Dogecoin Price Prediction: 4H Technical Analysis
Our Dogecoin technical analysis uses the 4-hour DOGE/USDT chart on Binance, captured at 09:39 IST (UTC+5:30) on September 24, 2026.
That keeps DOGE just above a rising trendline that has guided the move since around September 19.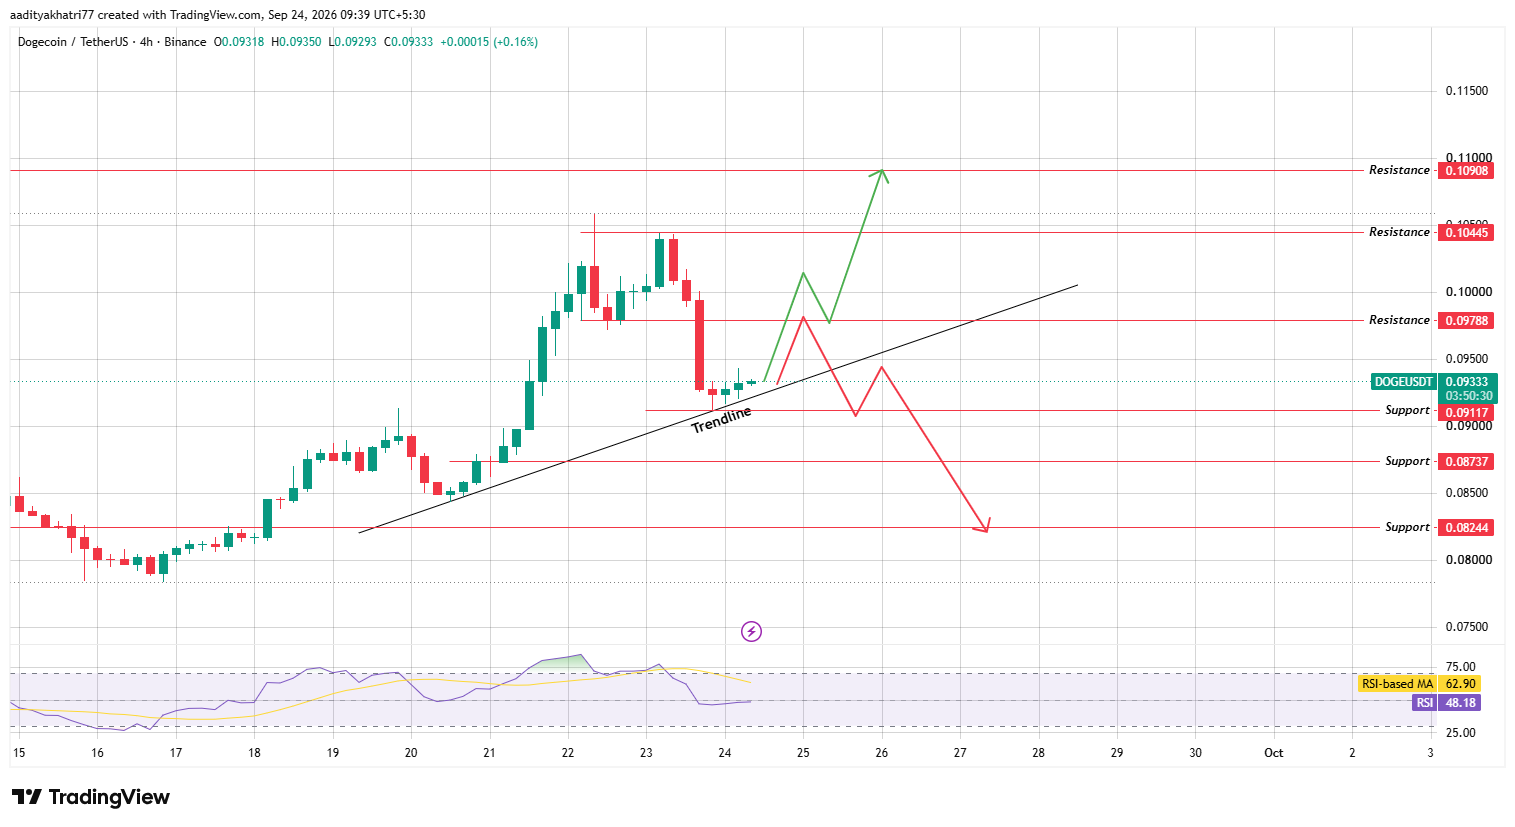
Source: Chart taken from TradingView, as of Sep 24, 2026
The trendline held during the September 23 pullback, when the low reached $0.09117.
Before that, $DOGE rallied from the $0.080 area to above $0.104 between September 17 and September 22.
The RSI now reads 48.18, below its moving average of 62.90. Momentum has cooled after climbing close to the overbought area earlier this week.
Even after that rally, DOGE trades roughly 87% below its May 2021 peak near $0.73. The recovery remains a long one.
Can Dogecoin Break Resistance and Move Higher?
The bullish case starts with a bounce from the trendline. The first hurdle is $0.09788, about 4.9% above the chart price.
A 4H candle body close above that level would confirm a breakout, and volume should be at least 1.5 times the average of the previous 20 candles.
A wick above the line without such a close does not count.
If that happens, the next resistance is $0.10445, roughly 11.9% higher. After that comes $0.10908, about 16.9% above the chart price.
The chart also allows a pullback toward $0.09788 before the second leg, which would be a normal retest.
That path would keep the short-term Dogecoin price prediction constructive into the first days of October.
What Happens If Dogecoin Faces Rejection?
The bearish case begins with rejection at or below the same resistance. Price would then drift back toward the rising trendline.
A 4H close under the trendline would weaken the structure. A close below $0.09117 would confirm the loss of support.
From there, the chart marks $0.08737 as the next floor, about 6.4% under the chart price. Below it sits $0.08244, roughly 11.7% lower.
A short bounce may appear before the decline, as the chart illustrates. The reaction at the trendline decides which side takes control.
Dogecoin Price Levels
The table below lists the Dogecoin price levels taken from the 4H chart.
Support | Resistance |
$0.09117 | $0.09788 |
$0.08737 | $0.10445 |
$0.08244 | $0.10908 |
Bull, Base, and Bear Scenarios
Scenario | Setup | Level |
Bull | 4H body close above $0.09788 with strong volume | $0.10445, then $0.10908 |
Base | Price holds the trendline at $0.09117 but stays below $0.09788. | $0.09117 to $0.09788 |
Bear | 4H close below the trendline and $0.09117 | $0.08737, then $0.08244 |
Dogecoin vs Bitcoin
DOGE fell 10.3% in dollar terms and 7.3% against Bitcoin. Those figures imply Bitcoin lost roughly 3% in the same 24 hours.
Most of the decline was therefore specific to $DOGE, though the wider market added some pressure meme tokens usually swing harder than Bitcoin.
A Bitcoin recovery would help the resistance breakout case, while more weakness there would raise the odds of a trendline break. Anyone weighing the Dogecoin price outlook 2026 should read both charts together.
Expert Opinion
General market commentary on $DOGE has centered on one question: can ETF inflows offset weak short-term momentum?
Analysts who follow meme tokens usually treat a hold above a rising trendline as constructive.
A close below it is read as an early sign of a deeper pullback. The chart here follows that same logic.
Any Dogecoin price prediction should be paired with a plan for position size and exit points. $DOGE moved 10.3% in one day, so risk control matters as much as direction.
Disclaimer: This article is for information only and is not financial advice. DOGE is highly volatile and moved 10.3% in 24 hours. Technical levels can fail, and price can move against every scenario above, including a total loss of invested capital. The scenarios carry no stated probability. Do your own research and never risk money you cannot afford to lose.
0
0

 Manage all your crypto, NFT and DeFi from one place
Securely connect the portfolio you’re using to start.


