Bitcoin wrestles with key moving averages and short term holder prices
0
0
Quick Take
Bitcoin’s 20% decline from its all-time high has raised concerns about the potential impact on the ongoing bull run.
To better understand the current market conditions, we can analyze Bitcoin’s price against key moving averages, widely used technical indicators in the digital asset space. One of the most crucial moving averages is the 111-day moving average (111dma), currently at $57,779. Bitcoin briefly dipped below this level, a scenario that has occurred in previous bull runs, notably in 2017. This moving average has historically been a critical support level during bullish periods.

Other key moving averages to watch include the 200-day moving average (200dma) at $49,278, the 365-day simple moving average (365dma) at $39,593, and the 200-week moving average (200wma) at $33,963. Bitcoin must maintain its position above these levels to keep the potential bull run alive.
According to Glassnode data, these moving averages serve different purposes. The Pi Cycle Indicator (111D-SMA) captures short-to-mid-term market momentum, while the Mayer Multiple (200D-SMA) is commonly associated with the transition point between bull and bear markets. The Yearly Moving Average (365D-SMA) provides a long-standing baseline for high time-frame market momentum, and the 200 Week Moving Average (200W-SMA) captures the baseline momentum of a classic four-year Bitcoin cycle.

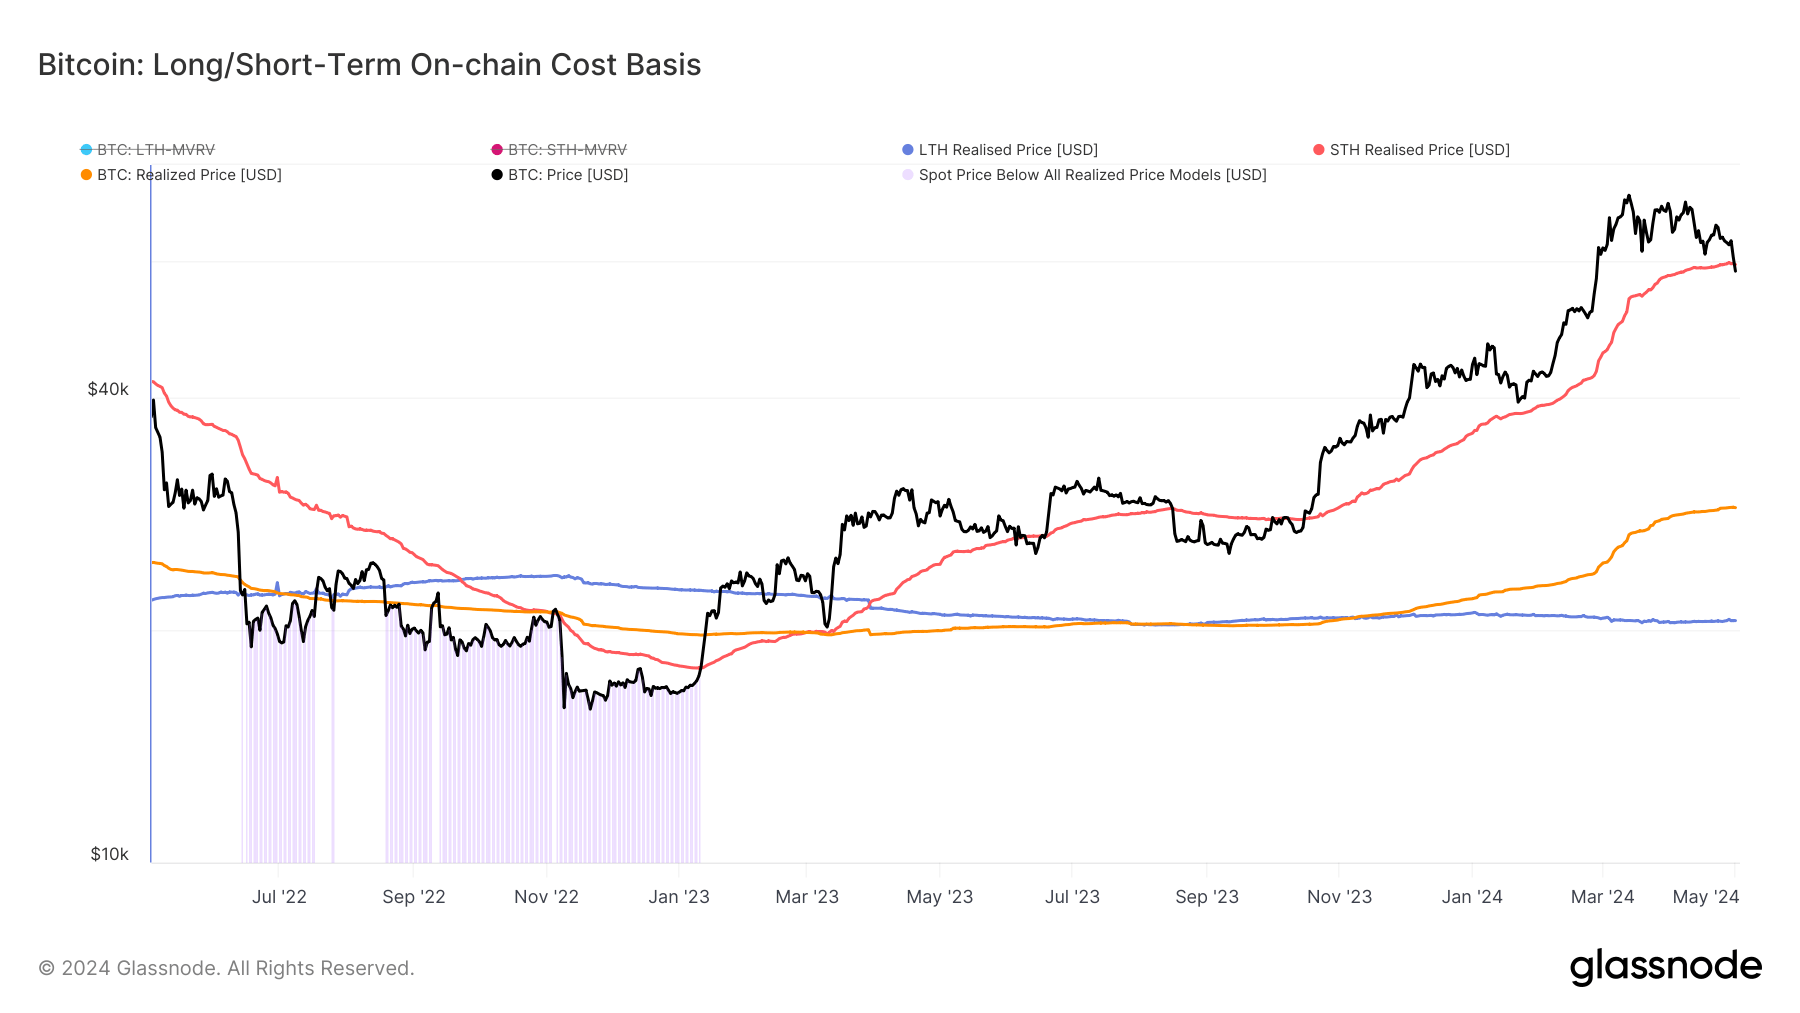
Additionally, Bitcoin has fallen below the short-term holder realized price, currently at $59,468. Reclaiming this level is considered a vital indicator of the digital asset’s potential recovery.

The post Bitcoin wrestles with key moving averages and short term holder prices appeared first on CryptoSlate.
0
0


