OKB (OKB) Price Prediction 2025–2030: Will OKB Hit $130 Soon?
0
0

- OKB surges past $100, signaling powerful breakout and bullish momentum.
- RSI hits 91.56 as MACD confirms strong upward trend.
- Long-term forecasts eye $145 by 2030 amid ecosystem growth.
OKB (OKB) has staged a dramatic breakout above the $100 level after months of sideways consolidation between $47 and $57. The surge began with a rally from the $46.16–$47.61 support range, clearing several supply levels and establishing one of the strongest daily percentage gains in recent years.
As of mid-August 2025, the token is trading at $103.20, well above its previous resistance at $86.98. The breakout over the century mark marks a decisive shift in structure, with the possibility of bulls maintaining control into the remainder of 2025.
A sustained daily close above $100 would reinforce this trend, while a loss of $86.98 would threaten the breakout structure and open the door to deeper pullbacks.
Bollinger Bands Expansion and EMA Alignment
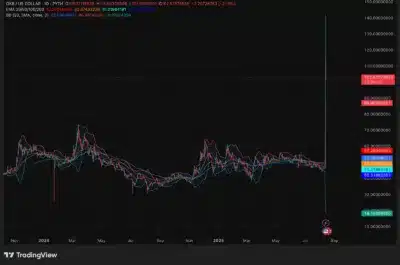
Even the technical background of OKB is favorable. The Bollinger Bands that were being squeezed as a result of the months of sideways trading are now breathing with great force. This kind of widening is a typical signal of the growth in volatility and is usually preceded by consolidation. The price of OKB has now risen far above the upper band to the price of 86.98, which shows the power of the breakout.
Exponential moving averages also support bullish orientation. The 20-day EMA is at 57.26, 50-day at 52.37, 100-day at 51.21 and 200-day at 50.31. All four moving averages sit well below current prices, forming a very bullish stack, with the red 20-day EMA serving as the initial line of dynamic support in the event of near-term retracements.

Source: Tradingview
RSI and MACD Momentum Strength Confirmation
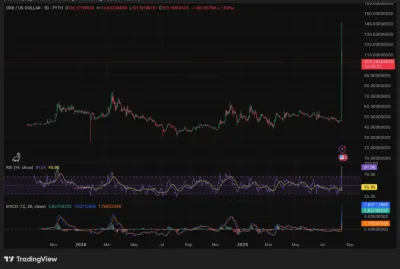
The relative strength index has soared to 91.56 on a daily basis which is an extreme reading indicating overbought conditions, yet also confirms the power of the breakout. During the significant trending periods, the elevated levels of RSI are likely to be accompanied by further price increase, not the reversals.
In the same way, the MACD highlights the strength of the market. MACD line has been positioned at 7.60 against the signal line at 5.85 and the histogram has been printing strong positive bars. The combination points out that momentum is heavily biased toward buyers, which is unlikely to change soon.

Source: Tradingview
Smart Money Concepts and Break of Structure
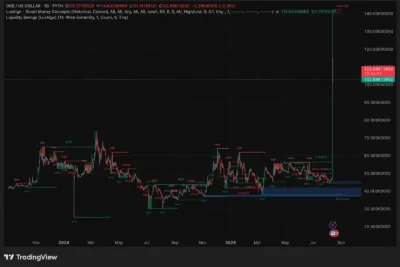
In terms of Smart Money Concepts, OKB has made several structure breaks on the daily time frame. The recent rally has been able to wipe the liquidity over the $60 area and this was a major point of resistance in the past.
The move above 100 is a break over a weak high which in most cases will be followed by renewed moves to new highs or a corrective retest of demand. Continuation in this instance may take OKB up to the level of $145, whereas a corrective phase may pull the price back to the block of demand around the level of $86.98-$87.00 after which the trend may continue.

Source: Tradingview
OKB Price Forecast 2025–2030
| Year | Minimum ($) | Average ($) | Maximum ($) |
| 2025 | 47.61 | 86.98 | 114.83 |
| 2026 | 60.00 | 92.50 | 120.00 |
| 2027 | 65.00 | 98.00 | 125.00 |
| 2028 | 70.00 | 102.00 | 130.00 |
| 2029 | 75.00 | 108.00 | 137.00 |
| 2030 | 80.00 | 115.00 | 145.00 |
2025
For the remainder of 2025, OKB’s trajectory will depend on whether it can sustain above $100. If bulls defend this level and keep $86.98 intact, the next upside test lies near $114.83. Conversely, should price break below this support, then buyers are expected to attack lower levels of $52.13 and $47.61. Either way, the pivotal zone to monitor has now shifted to the level of $100.
2026
In 2026, price stability above $86.98 would strengthen the case for a bullish continuation. If OKB consolidates and uses $100 as a new base, the market could stage a steady rise toward $120. Holding above a yearly average of $92.50 would provide confirmation that the bullish structure remains intact.
2027
By 2027, the focus will be made on the key resistance area around $125. In case OKB reaches this point, it might become consolidated in a range of $98 to $125 over a long period. During such a market-wide weakness, the token could retrace towards formidable supports at $65, which will be used as a structural defensive point.
2028
It is possible that by the year 2028, OKB will have the backing of the continued growth of the OKX ecosystem. That would enable the token to trade around an average price of around $102, with an upside to around $130. Pullbacks to the $70 area would be healthy corrections as opposed to higher structure reversals as long as the higher structure is intact.
2029
By 2029 a robust international crypto climate might drive OKB to $137. Average around the $108 level would be crucial in keeping this rally going and the 75 level should offer structural support in case of deeper corrections.
2030
At the end of the decade, OKB can soar up to a high of $145, should the ecosystem development keep going and the liquidity depth increase. The long term floor can be built around the price of $80, whereas the annual average can be expected to stabilize at the price of approximately $115.
Conclusion
OKB’s breakout above $100 is more than a short-term rally; it is a structural shift supported by multiple technical factors. The expansion of the Bollinger Bands signals heightened volatility, the EMAs remain aligned in a bullish configuration, and momentum indicators such as RSI and MACD confirm heavy buyer dominance.
From a structural perspective, Smart Money Concepts show that the market has cleared multiple resistance levels, leaving room for either a continuation toward $145 or a corrective retest into demand.
While near-term consolidation may occur due to the extreme RSI readings, the long-term framework remains bullish. As long as $86.98 holds as a support level, OKB is well positioned for steady gains, with the potential to climb toward $145 by 2030.
FAQs
1.Is OKB currently bullish?
Yes, the breakout above $100 with strong EMA and MACD alignment confirms bullish momentum.
2. Where is the next resistance level for OKB?
The next resistance lies at $114.83, with further targets near $125 and $145.
3. What is the most important support level?
The strongest support is $86.98, with deeper supports at $52.13 and $47.61.
4. Can OKB stay above $100 throughout 2025?
Yes, if buyers maintain control and defend $100, continuation toward $114.83 is likely.
5. What could drive OKB to $145 by 2030?
Sustained ecosystem growth, liquidity expansion, and structural support above $86.98 could carry it to $145.
Also Read: VeChain (VET) Price Prediction 2025–2030: Will VET Hit $0.02722 Soon?
The post OKB (OKB) Price Prediction 2025–2030: Will OKB Hit $130 Soon? appeared first on 36Crypto.
0
0
 Manage all your crypto, NFT and DeFi from one place
Securely connect the portfolio you’re using to start.


