
Hyperliquid Price Prediction Today: Can HYPE Rebound to $70?

0
0

$HYPE is trading around $63.77 right now, down over 2 percent, and currently recovering after a sharp fake breakout on the chart.
Fresh news around Hyperliquid's growing market share is also in play today, adding another angle to this Hyperliquid price prediction.
This HYPE price prediction today looks at both the chart structure and the news together to figure out what could move the price next.
Hyperliquid Price Right Now
Metric | Value |
$63.77 | |
Market Cap | $14.18B |
24H Volume | $379.21M |
Circulating Supply | 222,445,714 HYPE |
Total Supply | 955,307,079 HYPE |
Hyperliquid News Today
As per a tweet on X, Hyperliquid's HIP-3 markets now account for nearly 50 percent of daily perp volume, driven by growing demand for 24/7 onchain stock trading.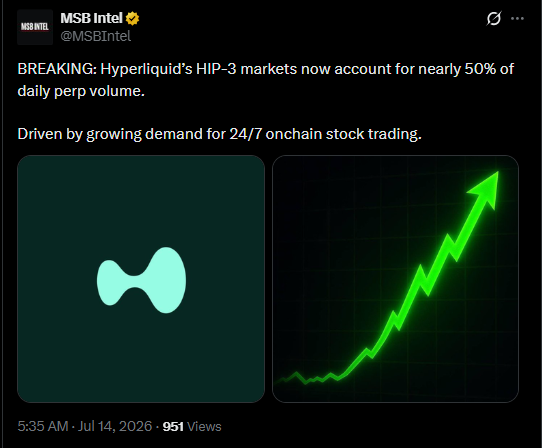
This kind of growth matters for any Hyperliquid price prediction because HIP-3 pulling in half of all daily perp volume shows real usage is scaling fast on the platform, not just speculative trading.
More adoption like this around on-chain stock markets usually builds long-term confidence in HYPE, even if the short-term chart is looking a bit shaky today.
Hyperliquid Liquidation Overview
Looking at this data, longs are getting rekt heavily across every single timeframe, from the 1H window all the way out to 24H.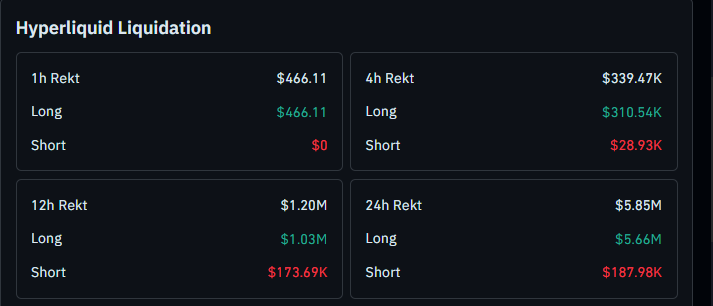
Source: Liquidation data by CoinGlass
This lines up closely with the sharp drop after the breakout failure, showing that long positions have been the ones absorbing most of the pain during this move.
Hyperliquid Price Prediction: Chart Analysis
On the 1-hour chart, HYPE has been trading under a descending trendline for the past several days. 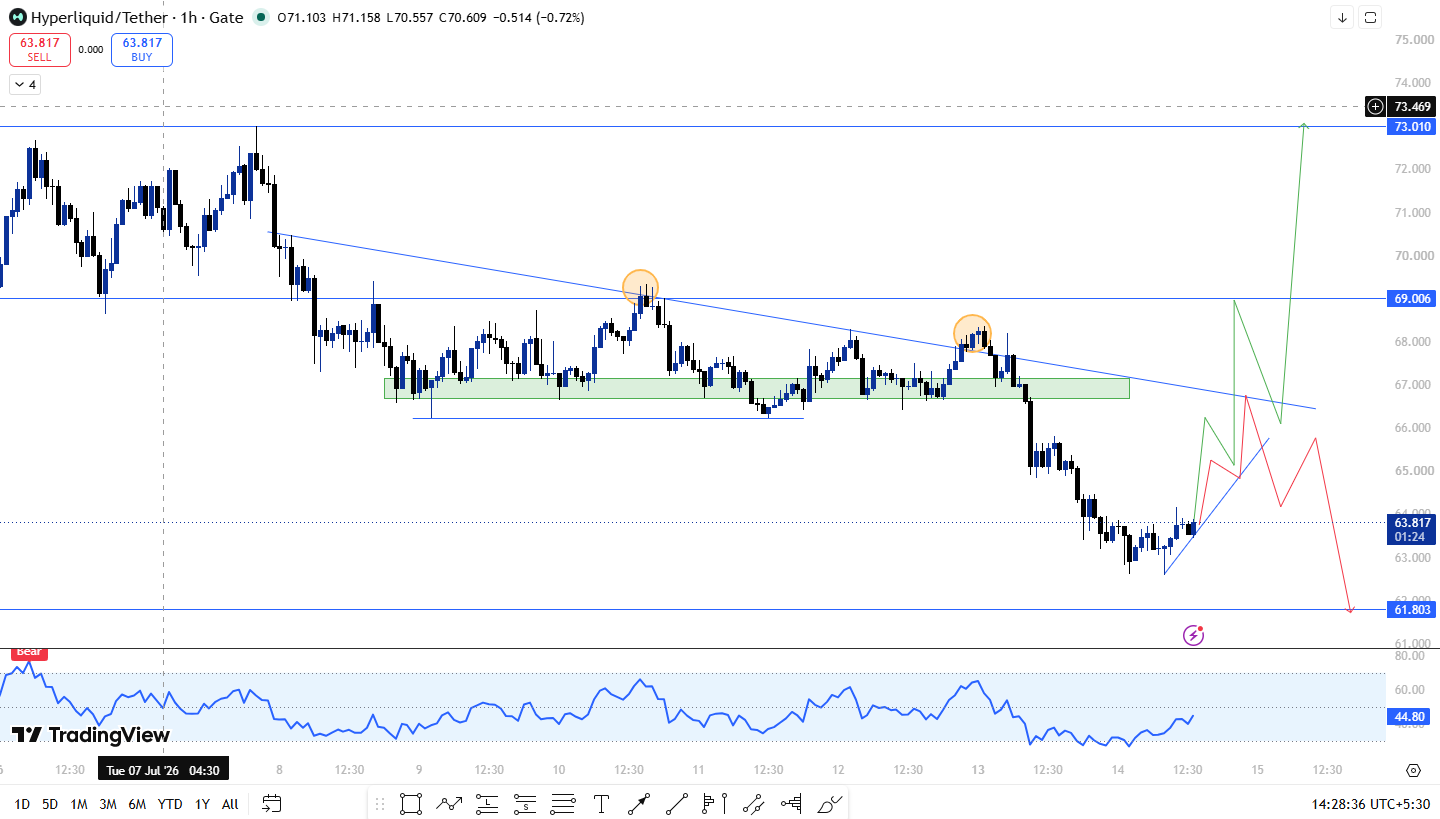
Price tapped this trendline once but failed to close above it, and that rejection sent HYPE into a lower low, shifting the short-term structure further into bearish territory.
After that failed attempt, Price came back and swept the liquidity sitting near the trendline again, this time managing to close above it.
For a moment it looked like a real breakout was in play, but the move failed almost instantly, and HYPE dropped nearly 9% right after that close.
At the time of this breakout failure, the RSI was sitting above 60, and once selling kicked in, the RSI dropped all the way below 30, showing just how aggressive that reversal was.
Since then, price has swept the liquidity sitting below the recent swing low and is now attempting to move back up from there.
There is a horizontal resistance zone sitting between $66.70 and $67.20, and this is the area where price could face selling pressure again if the recovery continues.
If HYPE clears this $66.7 to $67.2 zone with strength, the next resistance comes in at $69, followed by $73 further up.
On the downside, $61.8 remains the key support. A direct break and 1-hour candle close below $61.80 would invalidate this setup completely.
Support and Resistance Levels
Level Type | Price |
Resistance | $73.00 |
Resistance | $69.00 |
Immediate Resistance | $66.70 - $67.20 |
Support / Invalidation | $61.80 |
Risk and Reward: The Honest Version
Factor | Bull Case | Bear Case |
$61.80 Support Zone | Holds, HYPE continues the recovery push toward $66.7-67.2 | 1H candle closes below $61.80, setup invalidated |
$66.7-67.2 Resistance Zone | Clears with strength, opens path to $69 and $73 | Rejects again, price slides back down toward $61.80. |
The analysis above combines short-term chart structure with the latest Hyperliquid news and should not be treated as a guarantee of future performance.
Invalidation Level
This entire recovery structure depends on HYPE holding above $61.80.
A direct break with a confirmed 1-hour candle close below $61.80 would invalidate the setup completely, and in that case, HYPE would likely need to build a fresh base before any real recovery attempt becomes realistic again.
Expert View
Traders watching HYPE on the lower timeframe are treating the recent breakout failure as a strong warning sign, especially since price closed above the trendline briefly before dropping nearly 9 percent right after.
With RSI swinging from above 60 down to below 30 in such a short window, this kind of volatility suggests the market is still finding its footing.
Most agree the $66.7 to $67.2 zone will be the real test for this recovery attempt, since holding above it opens the path toward $69 and $73, while a rejection there could send the price back down to retest $61.8.
Keeping an eye on the fear and greed index can also help gauge sentiment around this kind of short-term setup.
Disclaimer: This article is for informational purposes only and should not be considered financial advice. Cryptocurrency markets are highly volatile, and price predictions are not guaranteed. Please do your own research before making any investment decisions.
0
0

 Manage all your crypto, NFT and DeFi from one place
Securely connect the portfolio you’re using to start.

0
0

0
0


0
0