
eCash Price Prediction: Why Is XEC Price Surging Today?

0
0

Traders scanning their watchlists this week keep landing on the same small-cap name. eCash price prediction chatter has picked up fast, and it's not hard to see why once you look at what's been happening on the chart. A coin that spent weeks grinding sideways just woke up, and that kind of move tends to grab attention whether you're holding it or not. So what actually changed, and does it have legs? That's what we're digging into.
Whats Behind The Current eCash XEC Price And Market Snapshot
| Metric | Detail |
|---|---|
| Coin Name | eCash |
| Ticker Symbol | XEC |
| Blockchain | eCash Network (Avalanche-based Consensus, Bitcoin ABC Fork) |
| Today High | $0.0000070626 |
| Today Low | $0.0000065549 |
| RSI Level | 74.28 |
| Token Type | Utility / Payments Token |
| Token Category | Digital Cash / Payments |
| Market Cap | $131.79M |
| 24H Trading Volume Change | +2424.14% |
| Circulating Supply | 20.05T XEC |
| 24H Change | +27.53% |
Source: Data by CoinMarketCap
What Exactly Is eCash And Why It Still Has A Following
eCash is a digital cash project built to work as everyday money rather than just a speculative asset. It runs on its own blockchain, which uses Avalanche-style consensus for faster confirmations.
The project traces back to the Bitcoin ABC team and has been around since 2021. Long-time holders stuck with it through years of quiet price action, betting on the payments angle eventually catching on.
Looking Back At How XEC Price Has Actually Moved
XEC hit its all-time high of $0.0005926 back in November 2021, five years ago, and it's still sitting almost 99% below that peak. But here's what most traders are missing: it also just printed a fresh all-time low near $0.0000047970 on July 1, 2026, only twelve days ago.
That means this week's rally is happening right off the back of a brand new bottom. The price is already up close to 39% from that low.
Basically, this isn't a coin drifting near old highs; it's one trying to claw back from record weakness, and that changes how you should read the bounce, especially with the current Bitcoin price outlook still shaping how much risk traders are willing to take on smaller names.
Why This Coin Matters Now Beyond Just The Price Chart
eCash isn't backed by a single company or a marketing budget. Its case rests on being simple, cheap to move, and genuinely usable for payments, not just trading.
The community around it has stayed active through years of sideways price action, and that's not nothing. Projects without real holders tend to disappear during quiet stretches, and this one didn't, even while the Ethereum ecosystem and other larger chains soaked up most of the attention.
eCash Liquidation Data Shows Where Short Sellers Got Hurt
Liquidation numbers tell a small but telling story here. Short positions have been getting wiped out across every timeframe, while long liquidations sat at exactly zero.
1h liquidation showed $3.65 in short liquidations, and 4h, 12h, and 24h windows all mirrored the same $3.65 figure. Small dollar amounts, sure, but the one-sided pattern lines up with a short squeeze narrative rather than pure organic demand.
Source: Liquidation data by CoinGlass
Does The eCash Fundamental Case Actually Hold Up Here
Fundamentally, XEC still leans on its low transaction cost and payments-first design. That pitch hasn't changed, and it's arguably more relevant given how expensive some larger networks remain for small transfers.
Breaking Down The eCash Technical Price Setup Right Now
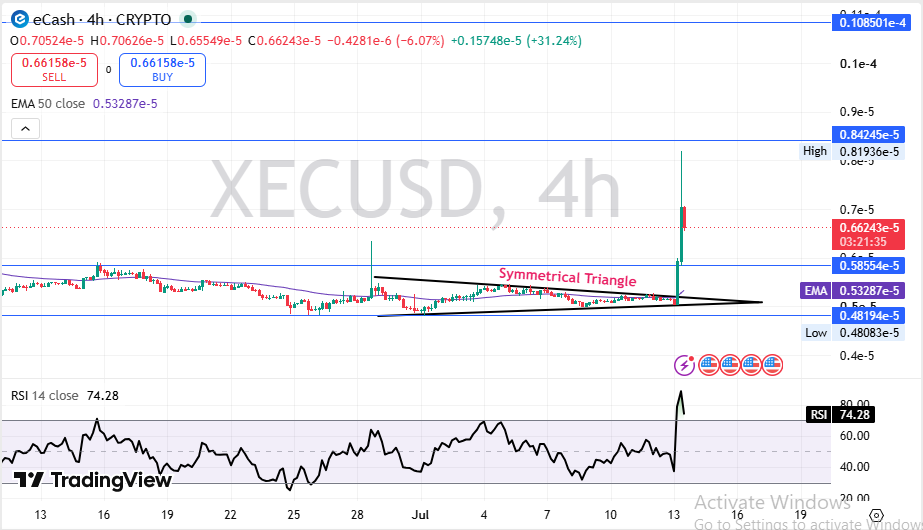
Here's the thing about this chart: the move didn't come from nowhere. Price had been coiling inside a symmetrical triangle on the 4-hour timeframe for weeks, squeezing tighter with every session.
Source: Charting by TradingView
Squeezes like that eventually resolve, and this one resolved. Price ripped through the top of the pattern on a volume spike, and RSI followed it straight to 74.28, deep into overbought territory.
That's the part that needs a second look. An RSI reading this hot rarely holds without at least a pullback first. Price is currently trading around $0.0000066243, sitting above its 50 EMA of $0.0000053287, which confirms buyers still control the short-term trend.
Immediate support sits at $0.0000058554.
Above this price, resistance stacks up at $0.0000084245 and then $0.0000108501. A weekly close below $0.0000048194 would invalidate this entire bullish structure.
Where Is XEC Trading Volume Actually Concentrated Today
Volume tells you where the real activity is happening, and right now MEXC dominates the spot side for XEC with $4.08M in trading volume.
Source: Volume heatmap by CoinGlass
How XEC Stacks Up Against Other Small Cap Altcoins
Compared to other payment-focused altcoins, XEC's move looks sharper but also thinner. Coins with deeper liquidity.
Smaller-cap names like XEC can move 20-30% in hours, but they can also give it all back just as fast. That's the tradeoff.
Short-Term eCash Price Prediction For The Coming Weeks
Over the next few weeks, price likely stays reactive to whether the breakout holds above support near $0.0000058554.
| Timeframe | Bearish Target | Base Target | Bullish Target | Key Trigger |
|---|---|---|---|---|
| 24 Hours | $0.0000058 | $0.0000068 | $0.0000078 | RSI cooling off from overbought levels |
| 3–7 Days | $0.0000052 | $0.0000072 | $0.0000084 | Volume follow-through after the breakout |
| 2–4 Weeks | $0.0000048 | $0.0000078 | $0.0000108 | Weekly close above triangle resistance |
Watch the volume. Without it, this move fades fast.
Long-Term eCash Price Prediction Through 2027 And Beyond
The long-term case depends less on this week's chart and more on whether payments adoption actually gathers pace.
| Timeframe | Bearish Target | Base Target | Bullish Target | Catalyst Needed |
|---|---|---|---|---|
| 3 Months | $0.0000040 | $0.0000090 | $0.0000150 | Sustained daily volume above $50M |
| 6 Months | $0.0000035 | $0.0000110 | $0.0000220 | Broader altcoin market recovery |
| End of Year | $0.0000030 | $0.0000140 | $0.0000300 | New exchange listings and merchant tools |
| 2027 Outlook | $0.0000025 | $0.0000180 | $0.0000450 | Real payments adoption at scale |
Honestly, the long-term case is speculative at best. It needs adoption, not just a chart pattern, to justify those bullish numbers.
Three eCash Price Scenarios Traders Should Prepare For
Worst Case: Breakdown below $0.0000048194 invalidation, dragged lower by a fearful broader market. Price revisits the recent all-time low zone.
Base Case: Price consolidates between support and the first resistance while RSI cools down. Most likely path over the next few weeks.
Best Case: Volume stays strong, price clears $0.0000084245, and momentum carries toward $0.0000108501 and beyond.
| Scenario | Price Range | What Triggers It |
|---|---|---|
| Worst Case | $0.0000040 - $0.0000048 | Breakdown below the invalidation level amid market-wide fear. |
| Base Case | $0.0000060 - $0.0000085 | Range-bound consolidation after the recent spike. |
| Best Case | $0.0000090 - $0.0000150 | Confirmed breakout supported by strong trading volume. |
Key eCash Price Levels Every Trader Should Watch Closely
Resistance zone: $0.0000084245 and $0.0000108501 above the current price, both prior swing-high areas.
Support zone: $0.0000058554, the level buyers defended right after the breakout.
Invalidation zone: Below $0.0000048194, near the recent all-time low print.
Analyst View And Final Thoughts On The eCash Setup
When we pulled up the RSI, the first thing that stood out was how stretched it already is at 74.28. That doesn't kill the bullish case, but it does mean chasing the pump here carries real risk.
The triangle breakout is real, and price holding above the 50 EMA backs up the bullish read. But an RSI this hot usually cools off before the next leg starts.
One factor outside the chart is worth tracking: the broader Fear and Greed Index just fell to 29, deep in fear territory, something also flagged in the latest crypto news roundup this week. A coin rallying against that backdrop is unusual and worth watching.
A weekly close above $0.0000058554 would go a long way toward confirming buyers are serious, not just squeezing shorts for a day.
The single most important level right now is that $0.0000058554 support. Lose it, and the bullish story weakens fast.
The chart set up the move. Whether it holds is up to the buyers now.
Disclaimer: This article is for educational purposes only and does not constitute financial advice. Crypto markets are volatile. Consult your investment advisor before making any investment decision.
0
0

 Manage all your crypto, NFT and DeFi from one place
Securely connect the portfolio you’re using to start.

0
0


0
0

0
0