
Bonk crypto RSI nears oversold as daily bearish trend meets fear-driven market

0
0
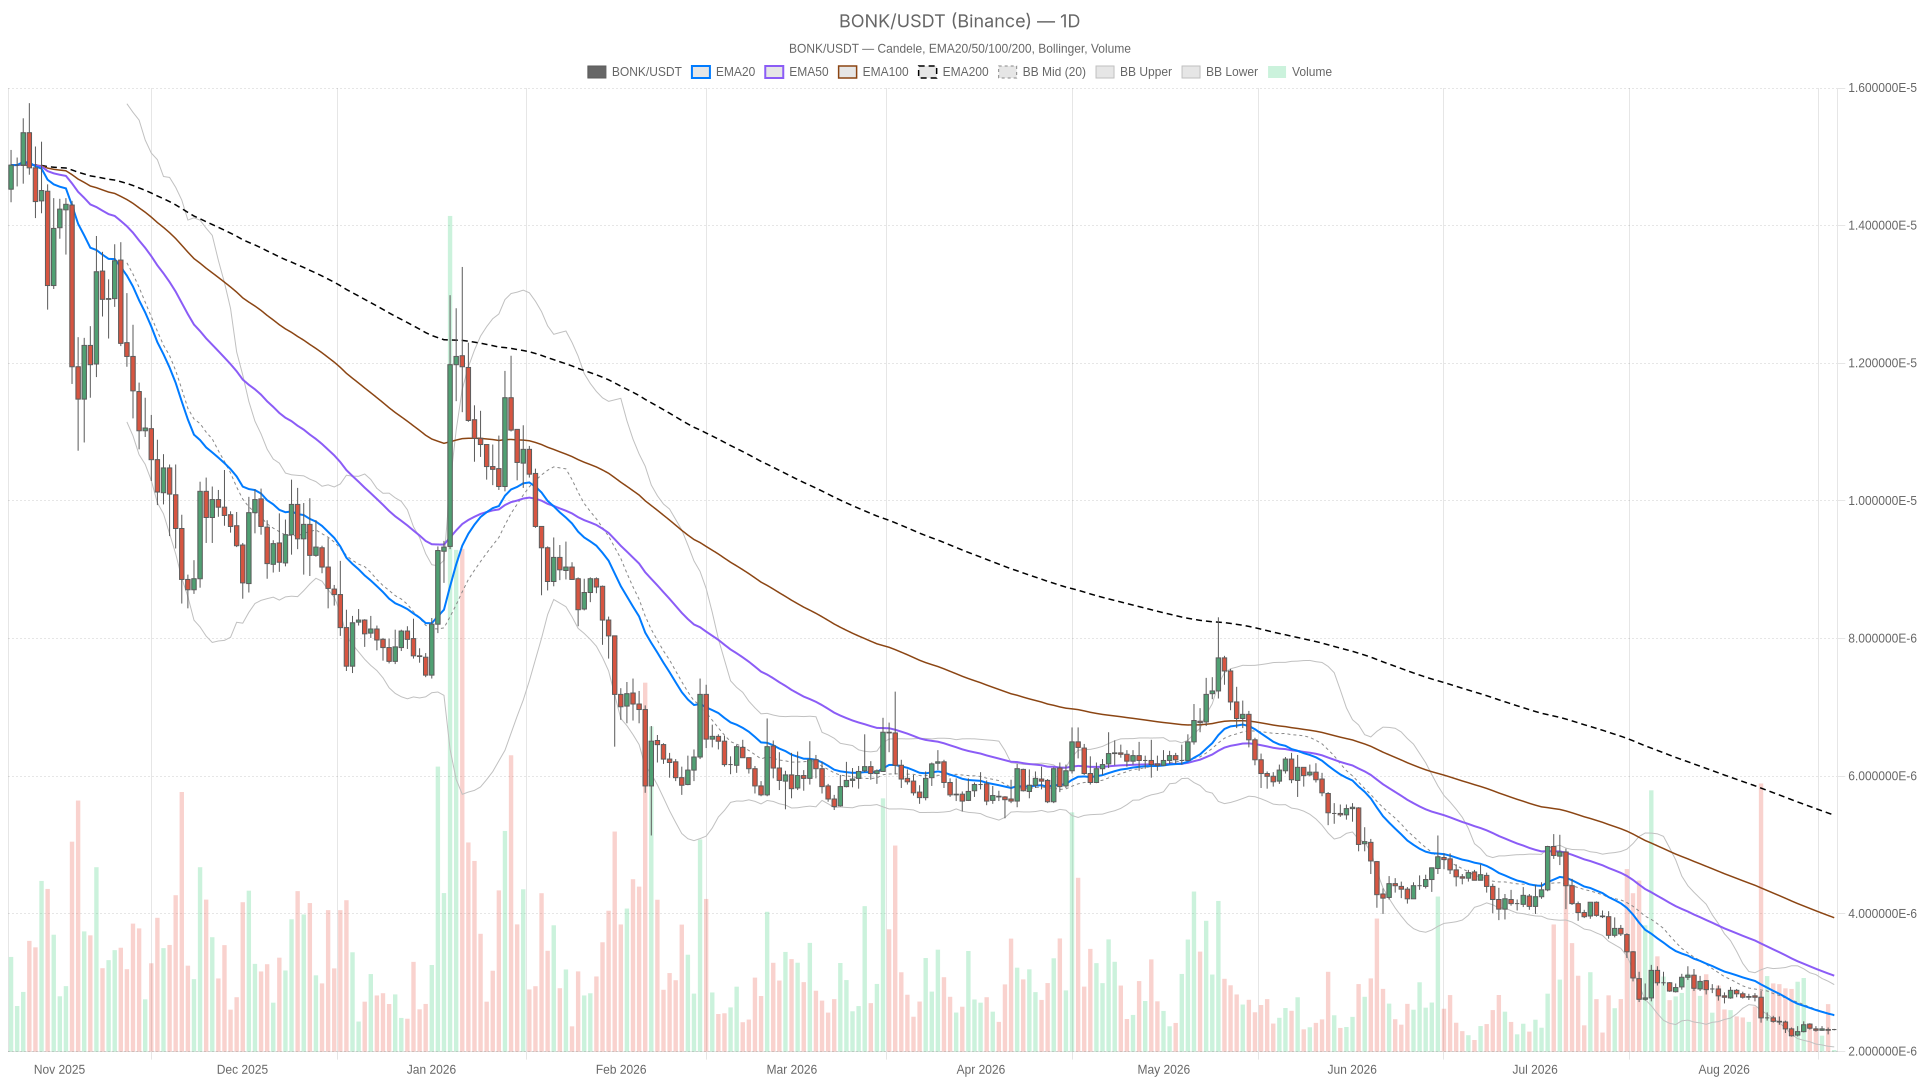
The broader market tape is turning cautious, and the pressure on meme tokens is building. As of August 19, 2026, Bonk crypto sits between a daily bearish regime and near-flat intraday momentum, a gap that leaves the next move unresolved.
Key takeaways
- The daily chart for BONK remains in a bearish regime, with RSI14 at 32.16 and nearing oversold levels.
- Hourly and 15-minute timeframes stay neutral; RSI sits at 50.46 and 48.38, respectively.
- The Fear & Greed Index reads 46 in “Fear,” while Bitcoin dominance holds near 56.6% of a roughly $2.28 trillion crypto market, according to CoinGecko-aggregated data.
- The broader market gained only 0.44% over 24 hours, favoring Bitcoin over high-beta meme tokens.
Daily Bias: Bearish Regime, But RSI Is Flirting With Oversold
The daily timeframe for BONK is flagged bearish, and the RSI14 reading of 32.16 backs that up. It is low enough to show real selling pressure, yet it is also creeping toward the oversold zone where downtrends often start losing steam. This is the classic tension in a bearish regime: the trend is still technically intact, but the fuel behind it is thinning out.
A reading in the low 30s does not automatically mean a reversal is coming. However, it does mean sellers are working harder for each new low, which is worth noting for anyone tracking BONK price action right now.
1H Structure: Neutral and Non-Committal
Move up to the hourly chart and the picture changes tone. The regime here is neutral, and RSI sits at 50.46 — almost dead center, showing neither buyers nor sellers have taken firm control. In practice, this means the daily bearish bias has not been confirmed on a shorter horizon. If anything, the 1H is telling us the market is pausing to digest the prior move rather than actively pushing lower. That is an important distinction: a stalling downtrend and a reversing downtrend look similar at first glance, but they resolve very differently.
15-Minute View: Execution Context Only
On the 15-minute chart, RSI reads 48.38 with a neutral regime as well. That sits a touch below the midline, hinting at a mild bearish tilt within the noise, but nothing that overrides the bigger picture. Still, this timeframe is not where you build a thesis; it is where you look for entries once the higher timeframes agree on direction. Right now, with daily bearish and 1H/15m neutral, there is no clean alignment across the board, which itself is a signal: the market has not decided yet.
Reading the Multi-Timeframe Conflict
This is where things get interesting for BONK specifically. The daily chart says the path of least resistance has been down, while the hourly and 15-minute charts show momentum has cooled off. When a lower timeframe fails to confirm a higher-timeframe trend, the move is often consolidating before continuation or quietly setting up for a bounce. Which one wins usually depends on the macro level, where the Fear & Greed reading and BTC dominance matter most.
Bullish Scenario
If the daily RSI basing in the low 30s marks genuine exhaustion of the selling wave, BONK could see a relief bounce. That would likely happen if the neutral 1H/15m regimes hold and short-term bears take profit. This scenario gets stronger if Bitcoin dominance stalls or eases, suggesting capital is looking for risk again. What would invalidate it: renewed downside pressure that drags RSI lower on the daily and flips the 1H regime bearish, confirming the downtrend is resuming rather than pausing.
Bearish Scenario
If BTC dominance keeps grinding higher, the daily bearish regime is likely to keep the upper hand. The same applies if the Fear & Greed Index stays anchored in “Fear” or drifts lower. Meme coins are typically among the first assets sold off in risk-averse phases, and BONK would not be an exception. What would invalidate this: dominance rolling over, the fear gauge improving toward neutral, and daily RSI reclaiming ground above the 50 line. Any of those would start chipping away at the bearish case.
Positioning and Risk
Right now, the honest read is that Bonk crypto is caught between a daily downtrend that has not fully confirmed on lower timeframes and a macro backdrop that is leaning cautious but not panicked. That is not a setup that rewards conviction in either direction — it is one that rewards patience and tight risk control.
Volatility can shift quickly in either scenario. Moreover, with dominance and sentiment both sitting in ambiguous territory, chasing either the bounce or the breakdown without confirmation is where most traders get caught offside. Whatever stance you take, sizing and stop placement matter more than usual until one of these timeframes breaks its current stalemate.
FAQ
What is the current daily trend for BONK?
The daily chart remains in a bearish regime, with RSI14 at 32.16 and approaching oversold territory. This shows selling pressure, but also hints that downside fuel may be thinning.
Are the shorter timeframes confirming the bearish trend?
No. The hourly and 15-minute charts are neutral, with RSI at 50.46 and 48.38 respectively. Lower timeframes have not yet confirmed the daily bearish bias.
What is driving the cautious mood around BONK?
The Fear & Greed Index sits at 46 in “Fear,” while Bitcoin dominance holds near 56.6% of a roughly $2.28 trillion crypto market. That mix typically pressures high-beta meme tokens.
Disclaimer: This article is for informational purposes only and does not constitute financial advice, an investment recommendation, or a solicitation to buy or sell any financial instrument or cryptocurrency. The analysis provided is not indicative of future results. Investing in crypto assets and financial markets carries a high risk of capital loss. Always do your own research (DYOR) and consult a qualified financial advisor before making any decision.
Article produced with the assistance of artificial intelligence and reviewed by the editorial team.
0
0


 Manage all your crypto, NFT and DeFi from one place
Securely connect the portfolio you’re using to start.

0
0

0
0

0
0

0
0