Cardano (ADA) Price Struggles as Large Transaction Volume Plummets
3d ago•

bullish:
0
bearish:
0
Share
Last month’s general market decline has impacted Cardano’s (ADA) price. It trades at $0.37, having witnessed an 18% price decline in the past 30 days.
On-chain data has revealed that this price dip has caused some of its biggest holders to reduce their trading activity.
Cardano Whales Seek to Reduce Exposure
Cardano (ADA) has witnessed a decline in large transaction volume in the last month. For example, during that period, the daily count of ADA transactions worth between $1 million and $10 million has dropped by 33%.
Likewise, the daily count of even larger transactions worth $10 million or more has dropped by 24% in the last 30 days.
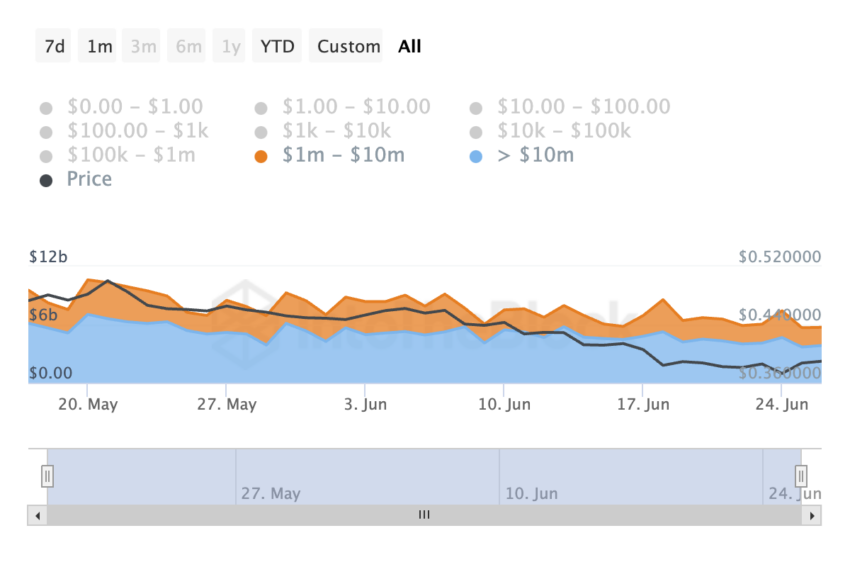 Cardano Transaction Volume. Source: IntoTheBlock
When an asset sees a decline in large transaction volume, it means there is a significant decrease in the number of big trades happening for that asset. This occurs when investors are not keen on trading the asset, which may be due to several reasons, the most significant being a shift in market sentiment from positive to negative.
An assessment of ADA’s weighted sentiment confirms this. At press time, the metric’s value is -0.58.
Read More: How To Buy Cardano (ADA) and Everything You Need To Know
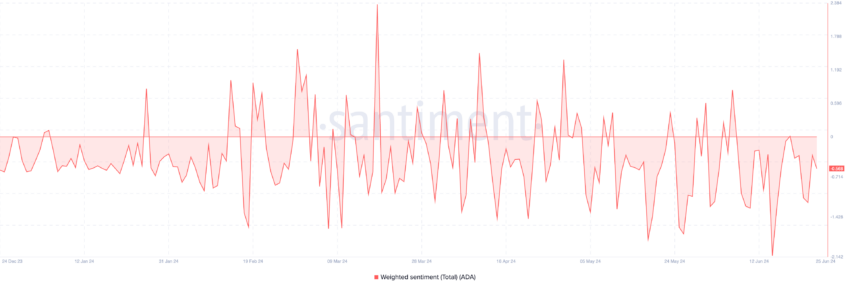 Cardano Weighted Sentiment. Source: Santiment
An asset’s weighted sentiment tracks the positive and negative mentions of an asset on social media platforms. When its value is less than zero, there is a general feeling of negativity among those discussing the asset.
Generally, a negative weighted sentiment is a precursor to a continued decline in an asset’s value. This happens because investors may hesitate to trade the asset, leading to decreased demand and a subsequent price drop.
ADA Price Prediction: Holders May Suffer More Losses
As assessed on a daily chart, some of ADA’s key technical indicators depict the decline in the coin’s demand among market participants. For example, its Relative Strength Index (RSI) has fallen below the 50-neutral line. Its value is 34.12 and is in a downtrend at press time.
This indicator measures an asset’s overbought and oversold market conditions. It ranges from 0 to 100, with values above 70 indicating that the asset is overbought and likely to decline, while values below 30 suggest that the asset is oversold and may experience a rebound.
At 34.12, ADA’s RSI suggests that the coin’s selling pressure outweighs its buying activity.
Further, its Directional Movement Index (DMI) shows that the increased selling activity has put the bears in control of the market since June 12. This indicator measures the strength of an asset’s price.
Read More: Cardano (ADA) Price Prediction 2024/2025/2030
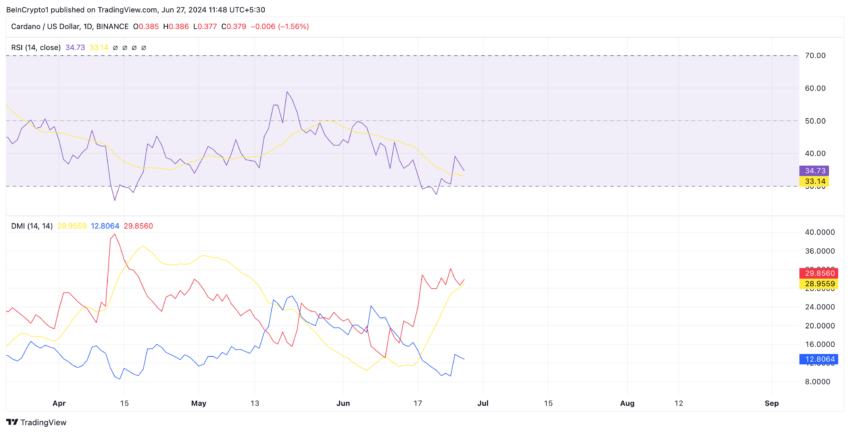 Cardano Analysis. Source: TradingView
At press time, its positive index (blue) rests under its negative index (red). When this indicator is set up this way, it is a bearish sign that confirms that selling pressure is significant.
If ADA sell-offs continue to increase, its value may dip to $0.35.
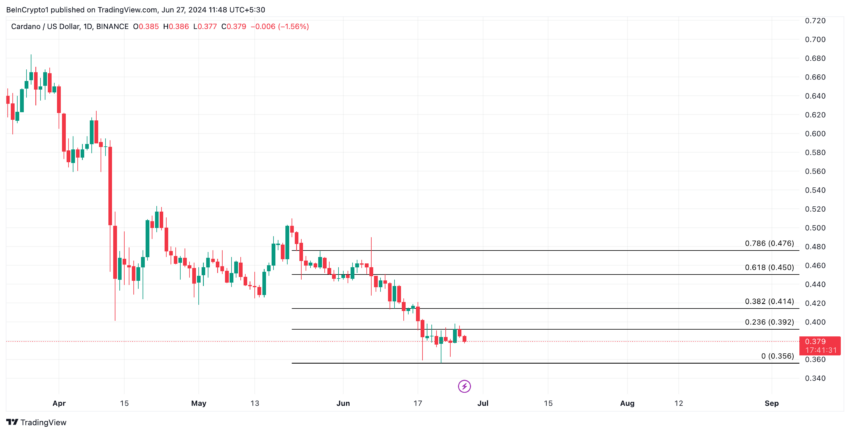 Cardano Analysis. Source: TradingView
However, if sentiment shifts from negative to positive, the spike in buying pressure can cause its value to climb to $0.41.
3d ago•
bullish:
0
bearish:
0
Share

 Manage all your crypto, NFT and DeFi from one place
Securely connect the portfolio you’re using to start.

bullish:
1
bearish:
0


bullish:
0
bearish:
0

bullish:
0
bearish:
0