Daily Analysis: BTC, ETH, DIA, LPT, STX

1
1

Bulls have now taken control of today’s session, with the global market cap sitting 3.6% above its previous 24-hour mark, as the total cap stands at $1.64T as of press time. The fear and greed index is 71, as greed dominates markets. The global trading volume is 3.8% up in 24 hours, at $65.7B as of press time.
Bitcoin Price Analysis
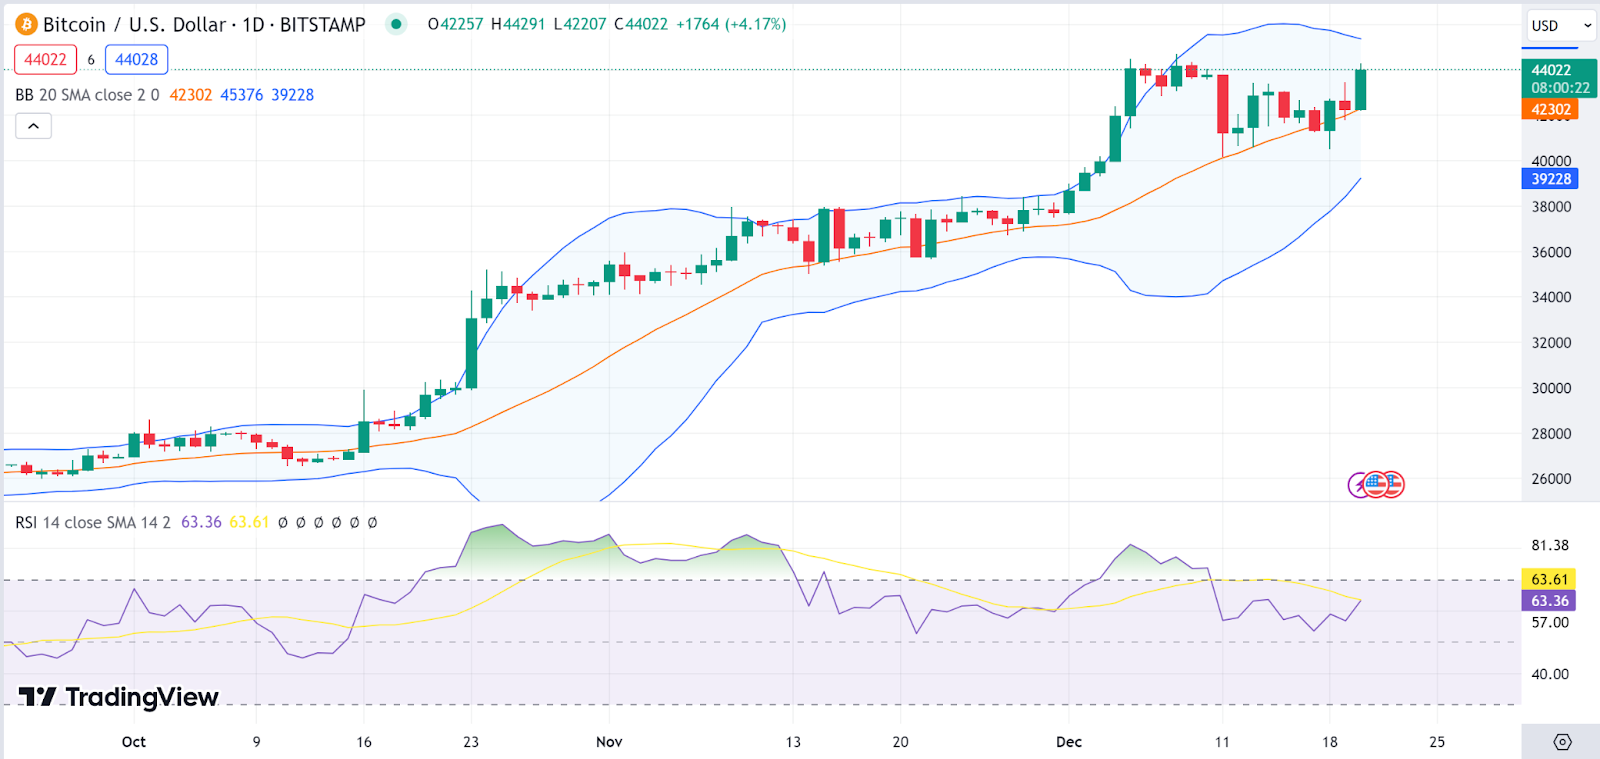
Bitcoin (BTC) is now riding on bull activity, as the *BTC* stood at $44.1K as of press time after recording a daily increase of 4.6% and a weekly rise of 4.1%. As a result of the Bitcoin price, the token’s trade volume jumped by 4.9% during the same period and is presently at $26.6B.
The Bollinger bands are far apart, showing high volatility levels on the Bitcoin price. The Relative Strength Index (RSI) is on the verge of breaking above the average line, showing bull activity on the Bitcoin price.
Ethereum Price Analysis
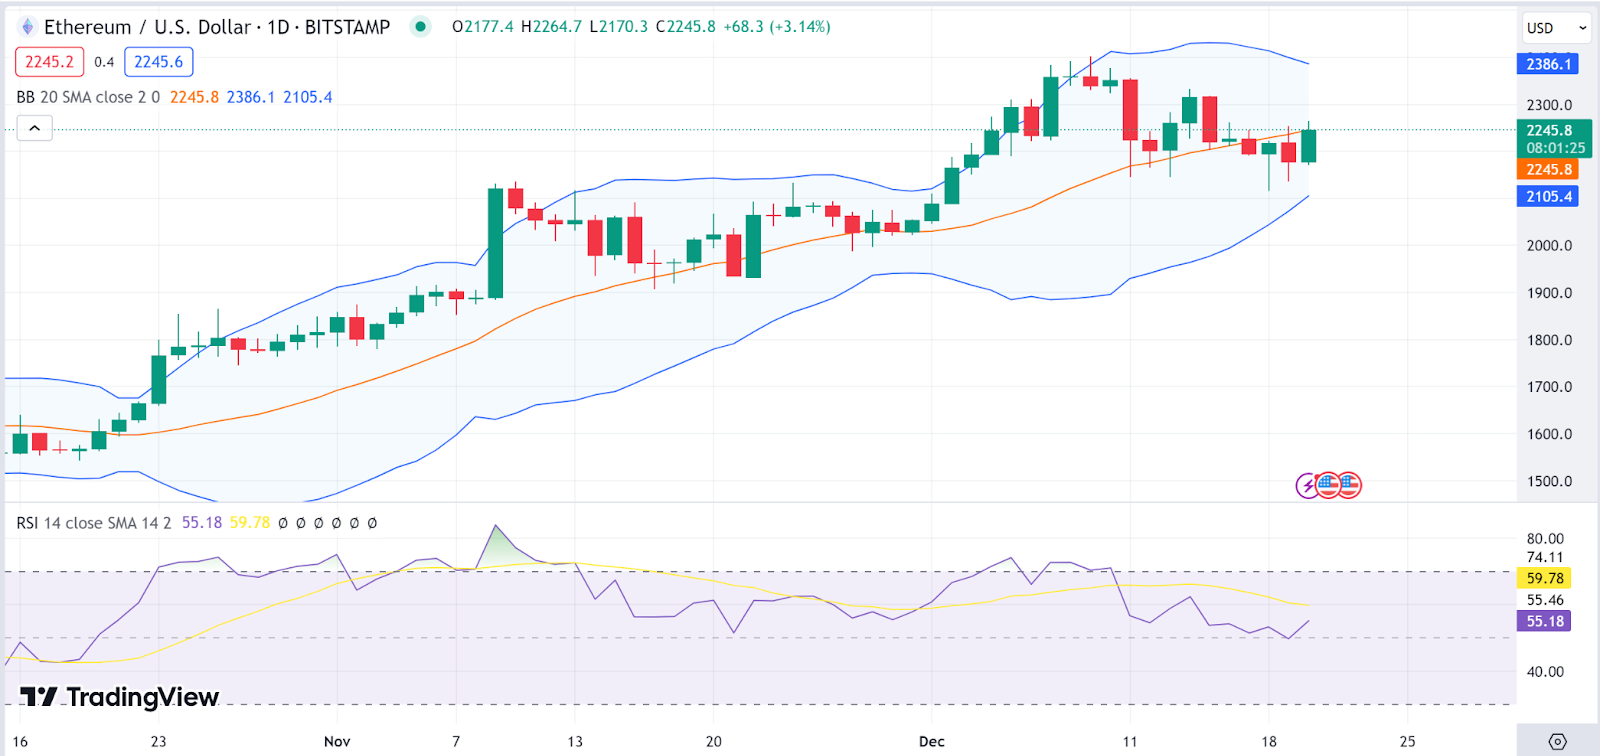
Ethereum (ETH) is also riding on bull activity, as the Bitcoin price stood at $2,226K as of press time after recording a daily increase of 2% and a weekly drop of 0.6%. As a result of the Ethereum price, the token’s trade volume dropped by 0.85% during the same period and is presently at $11B.
The Bollinger bands are far apart, showing high volatility levels on the *ETH*. The Relative Strength Index (RSI) is also headed towards a cross-over above the average line, showing bull activity on the Bitcoin price.
DIA Price Analysis
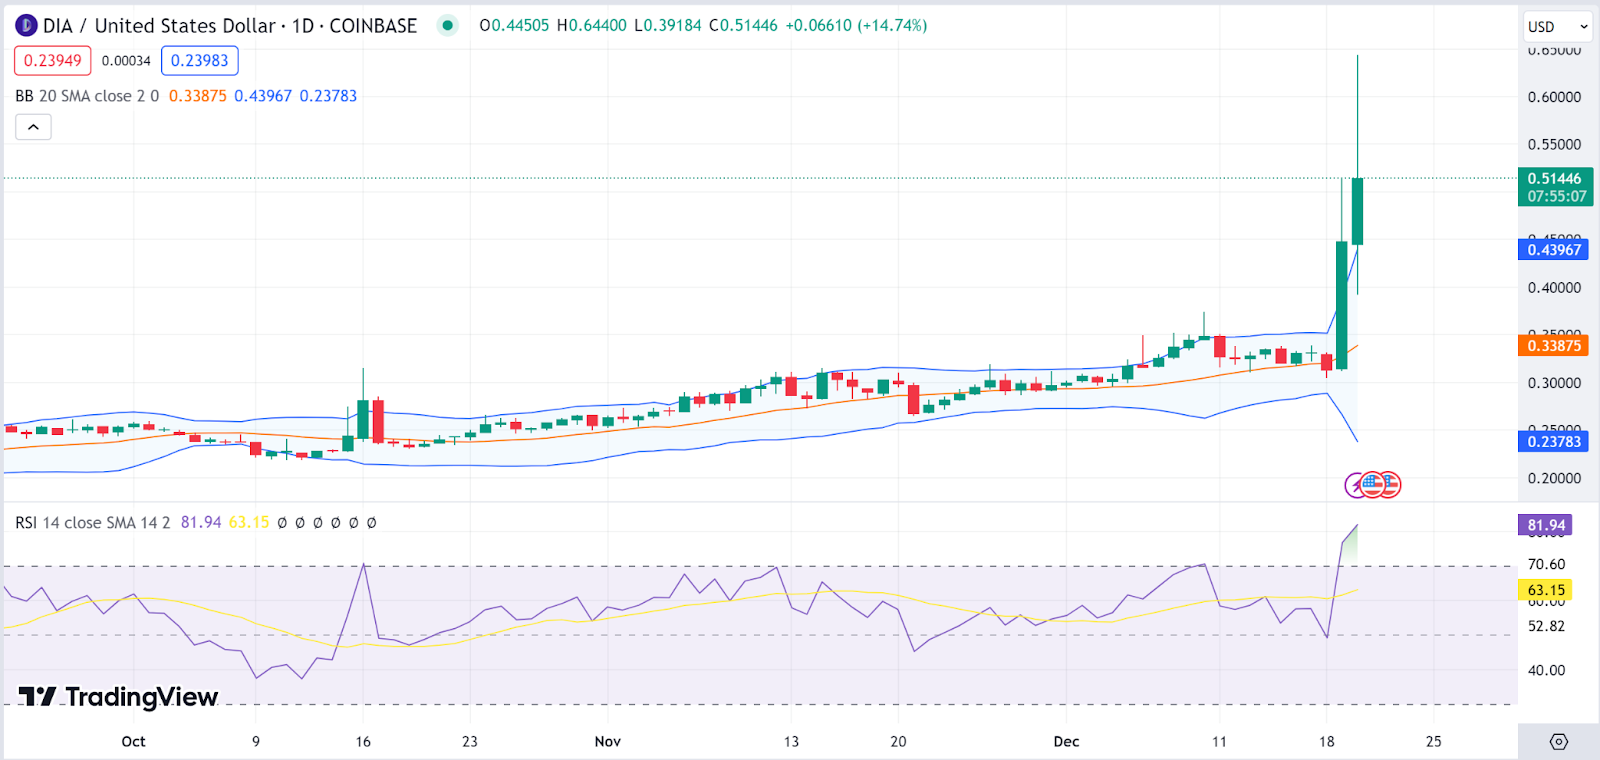
DIA (DIA) is now riding on bull activity, as the DIA price stood at $0.487 as of press time after recording a daily increase of 48% and a weekly rise of 49.1%. As a result of the DIA price, the token’s trade volume jumped by 2090% during the same period and is presently at $148M.
The Bollinger bands are diverging, showing high volatility levels on the DIA price. The Relative Strength Index (RSI) is above the average line in the overbought region, showing bull dominance on the DIA price.
Liverpeer Price Analysis
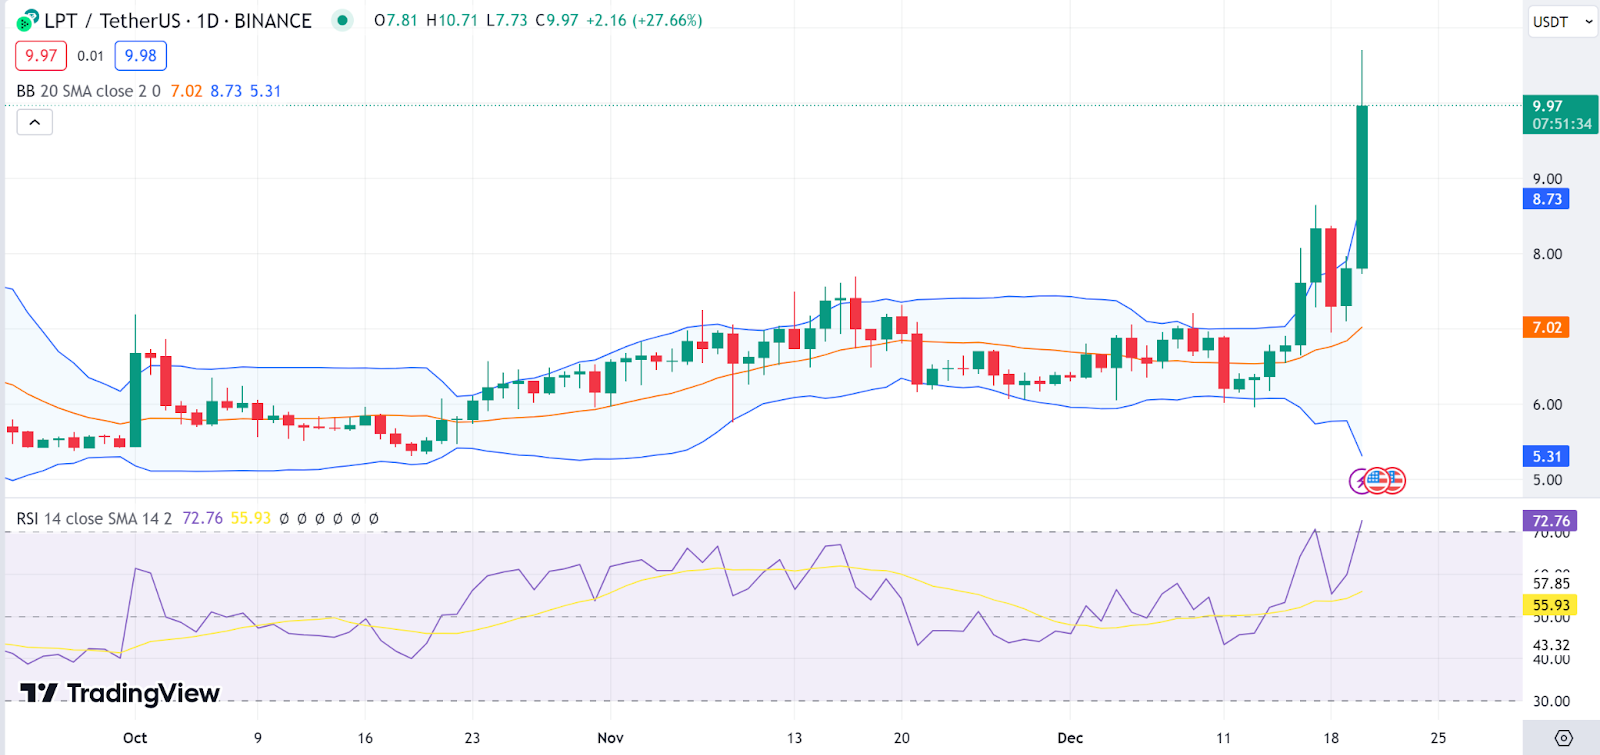
Livepeer (LPT) is also riding on bull activity, as the Livepeer price stood at $9.9 as of press time after recording a daily increase of 26% and a weekly rise of 57%. As a result of the Bitcoin price, the token’s trade volume jumped by 244% during the same period and is presently at $161M.
The Bollinger bands are diverging, showing high volatility levels on the Livepeer price. The Relative Strength Index (RSI) is above the average line in the overbought region, showing bull dominance on the Livepeer price.
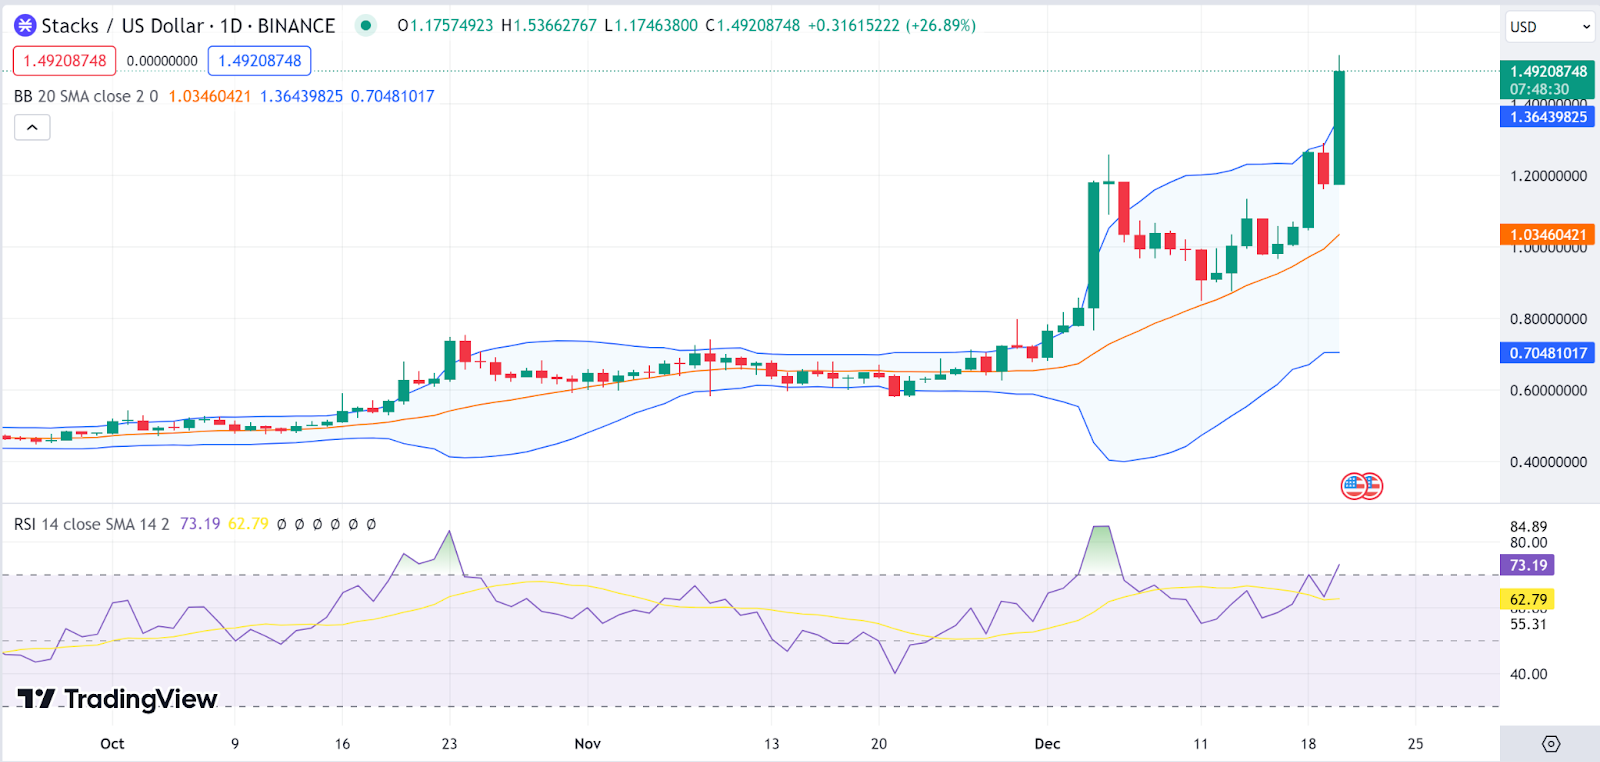
Stacks Price Analysis
Stacks (STX)) is also riding on bull activity, as the Stacks price stood at $1.54 as of press time after recording a daily increase of 29.8% and a weekly rise of 60.3%. As a result of the Bitcoin price, the token’s trade volume jumped by 111% during the same period and is presently at $524M.
The Bollinger bands are diverging, showing high volatility levels on the Stacks price. The Relative Strength Index (RSI) is above the average line in the overbought region, showing bull dominance on the Stacks price.
1
1

 Manage all your crypto, NFT and DeFi from one place
Securely connect the portfolio you’re using to start.