This Key Ethereum Level Has Historically Triggered Explosive Moves
0
0

Ethereum is sitting at a level that has the entire crypto market holding its breath — and popular on-chain analyst Ali Charts is sounding the alarm for good reason.
As of April 24, 2026 (7:30 UTC), ETH is trading at approximately $2,328, right at its Realized Price of ~$2,340.
Ali Charts, one of the most followed voices in crypto market analysis, flagged this convergence as a make-or-break moment — and the historical data backs him up completely.
What Ali Charts Is Watching — and Why You Should Too
According to Ali Charts, the Realized Price represents the average cost basis for every on-chain investor in Ethereum’s history.
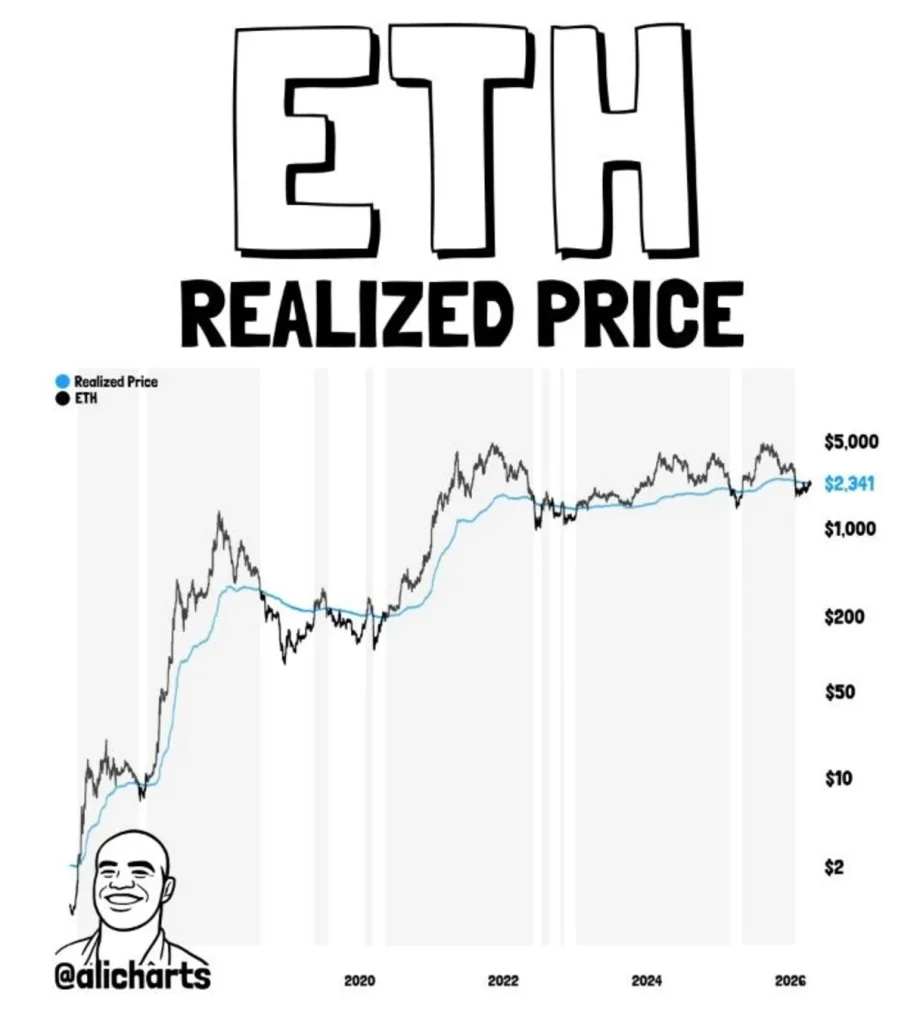
It’s not a speculative line drawn on a chart — it’s a hard, data-driven reflection of what the collective market actually paid for its ETH.
When the spot price dips to this level, the crowd is, on average, at breakeven. That psychological weight creates one of the most consequential battlegrounds in crypto.
The Historical Pattern That Changes Everything
Ali Charts has highlighted a recurring dynamic that every ETH investor should understand. During bear-market recovery phases, the Realized Price has repeatedly acted as a brutal distribution wall.
This is a zone where underwater investors sprint to exit the moment they stop losing money, crushing any rally attempting to push higher.
But here’s where it flips. When Ethereum has managed to reclaim this level and convert it into a firm support floor, the market has historically entered what Ali Charts describes as “high-conviction expansion phases” .
The kind of phase sends ETH on extended parabolic runs. The difference between ETH stalling here and ETH exploding higher comes down to one thing: whether this level holds as a floor or a ceiling.
What the On-Chain Data Backs Up
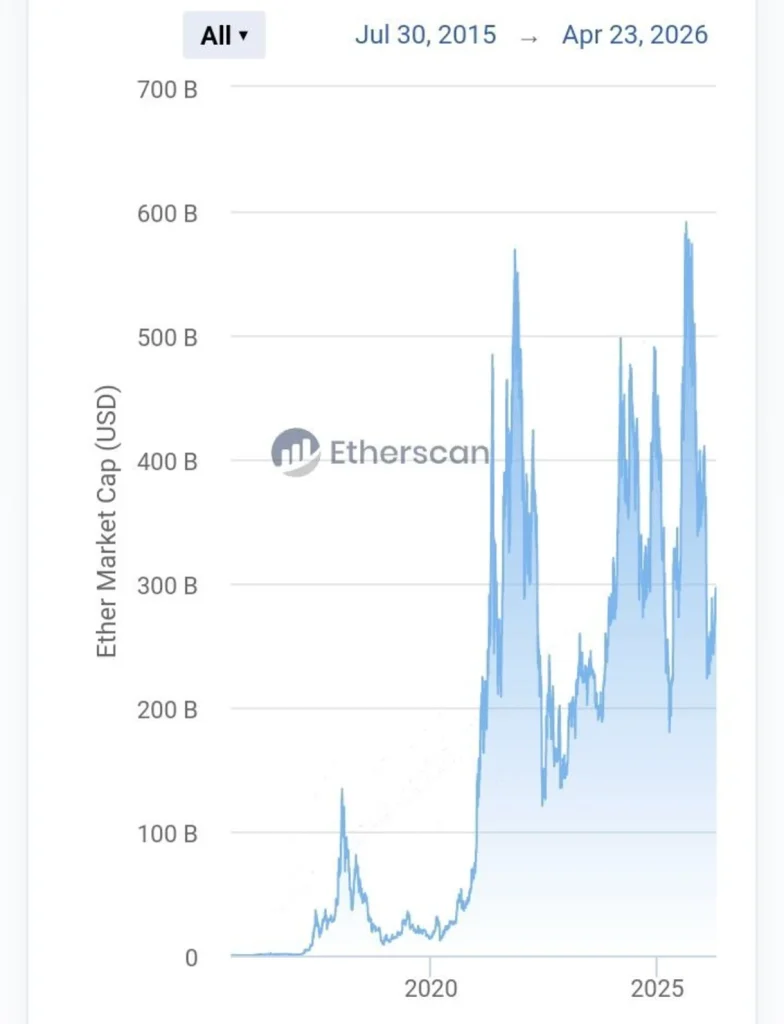
The current setup carries serious weight. Ethereum’s 24-hour trading volume stands near $15.8 billion, reflecting intense activity right at this critical zone.
The market cap holds around $280 billion, with 120.69 million ETH in circulation. Adding to the tension, the Fear & Greed Index is reading just 32 — deep in Fear territory.
The sentiment reading has historically preceded sharp reversals when it aligns with key structural levels.
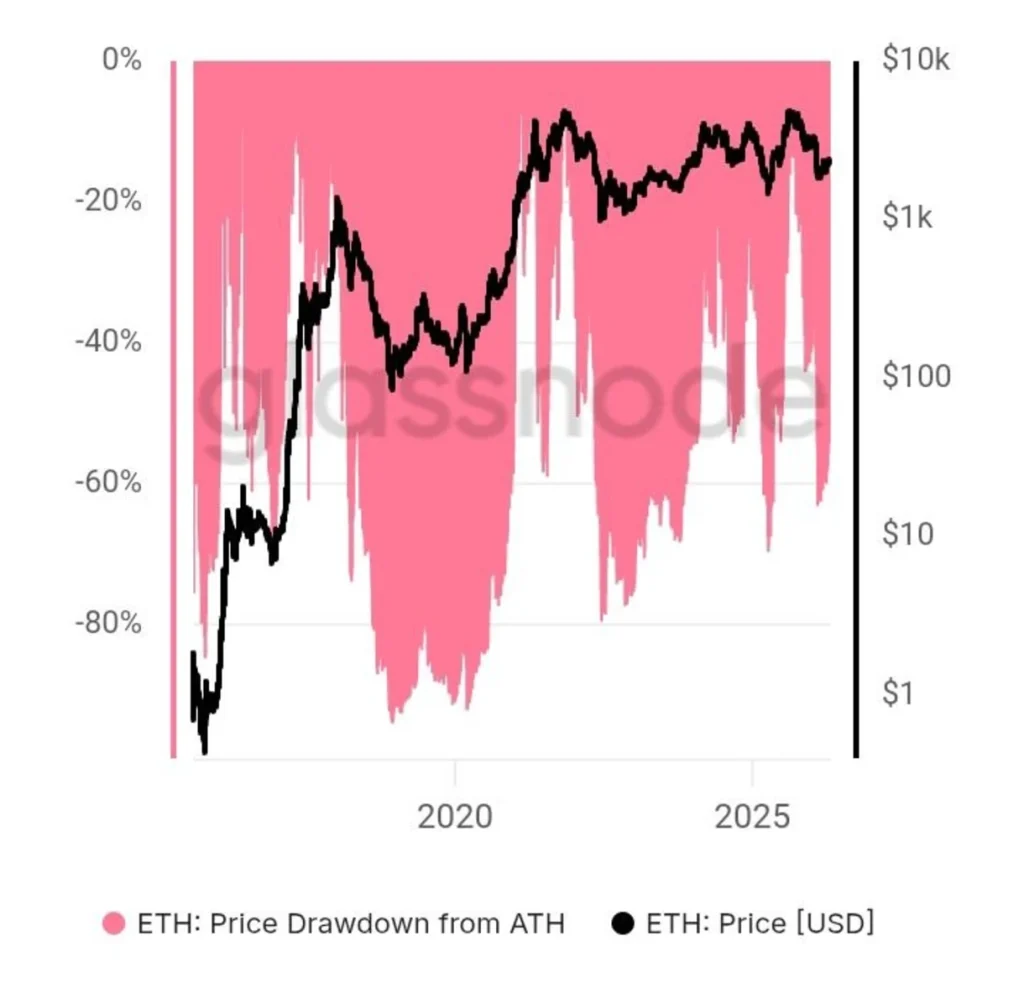
With ETH’s all-time high of $4,953 hit as recently as August 2025, the current price represents a steep discount — and a massive opportunity if the bulls can hold the line.
The Line in the Sand
Ali Charts puts it plainly: bulls need a sustained close above $2,340 with volume conviction.
Achieve that, and the Realized Price stops being a wall and becomes a launchpad. Fail, and ETH risks slipping back into distribution territory — keeping investors in limbo while the macro picture unfolds.
The level is clear. The analyst has spoken. The chart is at a crossroads.
So the real question is — will Ethereum finally flip its Realized Price into permanent support, or will history’s distribution wall hold once again?
Disclaimer:
This article is for informational purposes only and does not constitute financial, investment, or trading advice. The views expressed are based on publicly available data, market observations, and the author’s interpretation at the time of writing. Cryptocurrency markets are highly volatile and unpredictable, and past performance or current technical setups do not guarantee future results. Readers should conduct their own research and consult with a qualified financial advisor before making any investment decisions. TechGaged does not accept liability for any losses incurred based on the information presented.
The post This Key Ethereum Level Has Historically Triggered Explosive Moves appeared first on TechGaged.com.
0
0

 Manage all your crypto, NFT and DeFi from one place
Securely connect the portfolio you’re using to start.


0
0


0
0