
Pepe Price Prediction: PEPE Outruns Entire Top 100, What's Next?

0
0

Pepe has staged one of the sharpest moves in the entire market today, outpacing every other token in CoinMarketCap's top 100 by percentage gain.
This Pepe price prediction breaks down the technical structure behind the rally and what could come next.
Pepe launched in 2023 as a meme token inspired by the Pepe the Frog internet character, quickly building one of the largest communities in the meme coin space.
Since then, $PEPE has grown into a multi-billion-dollar asset, with trading activity concentrated heavily on major exchanges.
The Pepe price today stands at $0.00000513, up 27.2% over the past 24 hours.
Live Market Data
Metric | Value |
Price | $0.00000513 |
24h Change | +27.2% |
24h Range | $0.00000403 - $0.00000534 |
Market Cap | $2.158B |
Source: market data taken from CoinGecko, as of Sep 22, 2026. Figures may vary slightly across other tracking websites.
PEPE Holder Concentration
Tier | Holder Count | % of Holders | % of Market Cap |
Whale | 742 | 0.13% | 90.38% |
Shark | 3,868 | 0.65% | 4.80% |
Dolphin | 23,809 | 4.03% | 3.22% |
Fish | 87,466 | 14.80% | 1.28% |
Crab | 164,678 | 27.87% | 0.29% |
Shrimp | 310,340 | 52.52% | 0.03% |
Source: Data Taken From Etherscan, as of Sep 22, 2026
Whale wallets make up just 0.13% of all holders but control 90.38% of PEPE's market capitalization, according to on-chain analytics.
The top 100 holders alone account for 77.15% of supply, with 19 wallets each holding at least 1% of total supply.
This level of concentration means large holder activity can meaningfully influence price swings like today's rally.
Pepe News Today: Outpacing the Entire Top 100
According to BSCN, PEPE is outrunning the entire top 100 today, with the token's 28% single-day jump marking the biggest gain on CoinMarketCap's leaderboard. 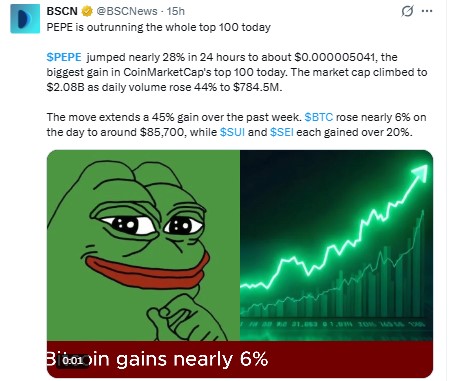
Source: Data Taken From @BSCNews, X Account, as of Sep 22, 2026
The report noted that PEPE's market cap climbed to $2.08 billion as daily volume rose 44% to $784.5 million, extending a 45% gain over the past week.
The outlet also pointed out that broader market conditions were supportive, with Bitcoin rising nearly 6% on the day to around $85,700.
While SUI and SEI each gained over 20%, suggesting today's Pepe news comes amid a wider altcoin rally rather than in isolation.
Technical Analysis: PEPE Breaks Rounded Bottom Neckline
On the daily chart, PEPE spent August forming a rounded bottom structure, gradually curving higher after a period of consolidation. 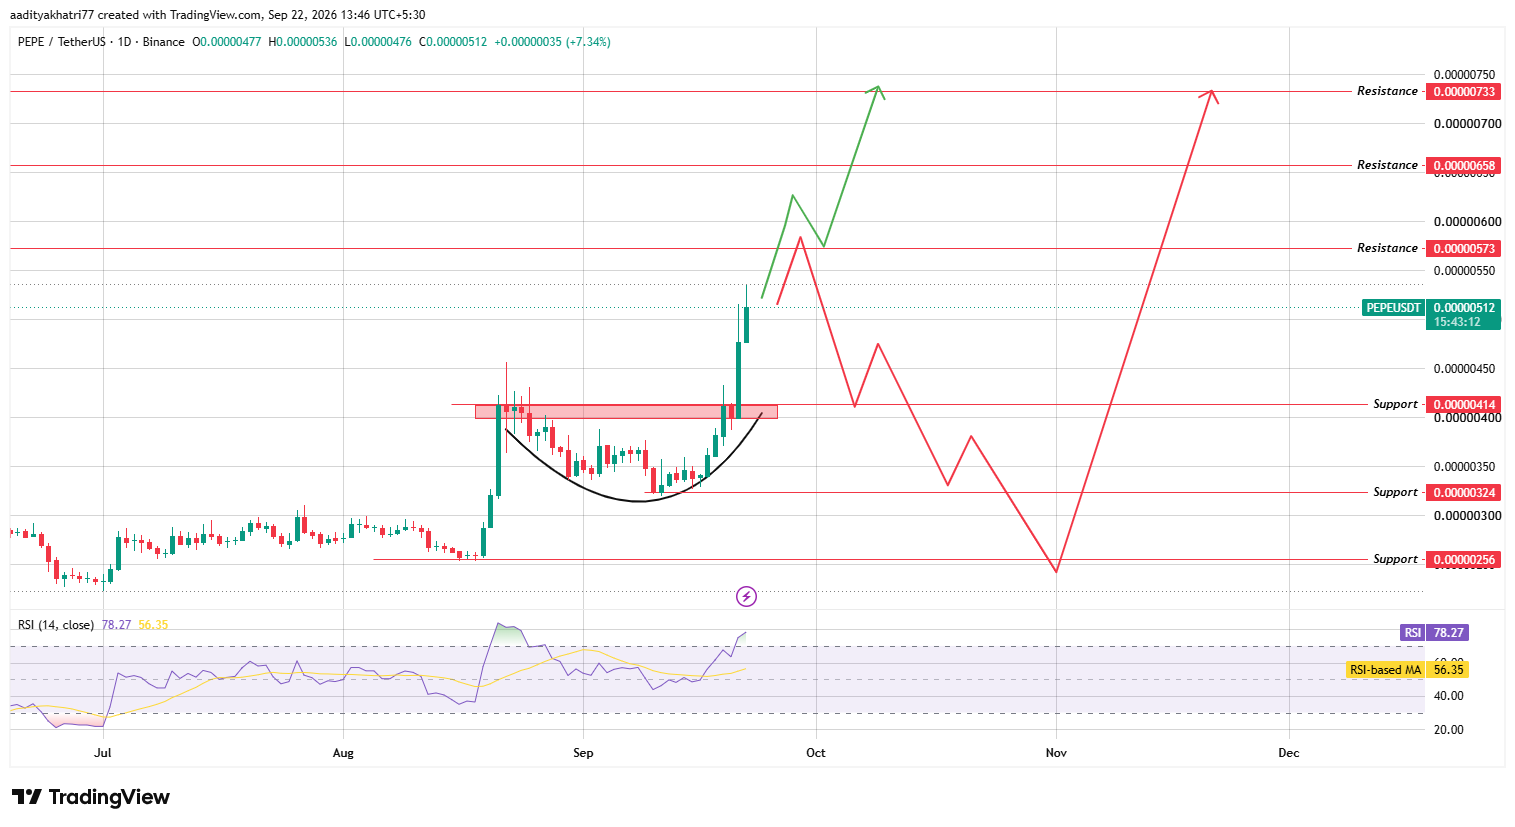
Source: Chart taken from TradingView, as of Sep 22, 2026
Price has now broken above the neckline of that pattern, and today's rally has pushed it directly into resistance.
RSI has climbed to 78.27, well above its moving average of 56.35, placing the token firmly in overbought territory even as momentum remains strong.
Can $PEPE Push Toward Higher Resistance?
If the price closes above $0.00000573, the next resistance sits at $0.00000658.
A confirmed break through that level would open the path toward $0.00000733, extending the rounded bottom breakout into a larger trend move.
This scenario would align with the strength BSCN highlighted in its report on PEPE's outperformance across the top 100.
What Happens If $PEPE Is Rejected?
If the price is rejected at the current resistance and turns lower, the first support to watch is $0.00000414.
A break below that level would expose $0.00000324, and continued weakness could extend the decline toward $0.00000256.
Given the overbought RSI reading, a pullback to consolidate gains would not be unusual even within an otherwise bullish structure.
Support and Resistance Levels
Support | Resistance |
$0.00000414 | $0.00000573 |
$0.00000324 | $0.00000658 |
$0.00000256 | $0.00000733 |
Bull, Base, and Bear Scenarios
Scenario | Setup | Level |
Bull | Confirmed break above resistance | $0.00000658 - $0.00000733 |
Base | Price consolidates near current resistance. | $0.00000414 - $0.00000573 |
Bear | Rejection and breakdown below support | $0.00000324 - $0.00000256 |
Pepe vs Bitcoin
PEPE's 27.2% gain today far outpaces Bitcoin's roughly 6% move on the same day, showing that while the broader market rally provided a supportive backdrop, PEPE's move was driven by asset-specific momentum, including the confirmed technical breakout.
Meme coins like PEPE often see amplified reactions during broad market upswings, and today's outperformance across the top 100 reflects that pattern clearly.
Methodology
This Pepe price prediction September 2026 analysis is based on daily candlestick data from Binance, sourced through TradingView, combined with live market data from CoinGecko and holder distribution data from on-chain analytics.
Support and resistance levels are drawn from the rounded bottom structure and neckline breakout visible on the chart.
RSI readings are used to assess momentum. All figures reflect data captured as of September 22, 2026, and remain subject to change.
Expert Opinion
Analysts tracking meme coin rotations note that PEPE's move stands out even within a broadly positive market, given its outsized percentage gain relative to peers like SUI and SEI.
Whether the rally extends toward $0.00000733 or cools off near current resistance will likely depend on whether volume remains elevated in the sessions ahead, rather than the neckline breakout alone.
Disclaimer: This article is for informational purposes only and should not be considered financial advice. Cryptocurrency markets are highly volatile, and prices can move sharply in either direction. The scenarios outlined above are based on current chart patterns and are not guaranteed outcomes. Readers should conduct their own research and consider their risk tolerance before making any investment decisions.
0
0

 Manage all your crypto, NFT and DeFi from one place
Securely connect the portfolio you’re using to start.


