Best and Worst Performing Altcoins for the Second Week of June 2024
8d ago•

bullish:
1
bearish:
0
Share

This past week, the cryptocurrency market has experienced mixed sentiments. While some assets have soared to new highs, others have plummeted to new lows.
Over the past week, Oasis (ROSE) and Toncoin (TON) have emerged as top-performing altcoins. In contrast, Floki (FLOKI) and Wormhole (W) have experienced the most declines during the same period.
Oasis (ROSE) Climbs to a Two-Month High
The price per Oasis (ROSE) token has risen by 8% in the last week. The altcoin currently trades at $0.12, its highest price since April 8.
Currently, the altcoin is above its 20-day Exponential Moving Average (EMA). This moving average tracks the token’s average price over the past 20 days.
When an asset’s price rests above this level, it signals a spike in buying pressure. It is a bullish signal which suggests that the asset’s current value is higher than its average price in the past 20 days.
ROSE’s Aroon Up Line was 85.71%, confirming the current uptrend. This indicator identifies an asset’s trend strength and potential price reversal points.
When an asset’s Aroon Up line is close to 100, it indicates that the uptrend is strong and that the most recent high was reached relatively recently.
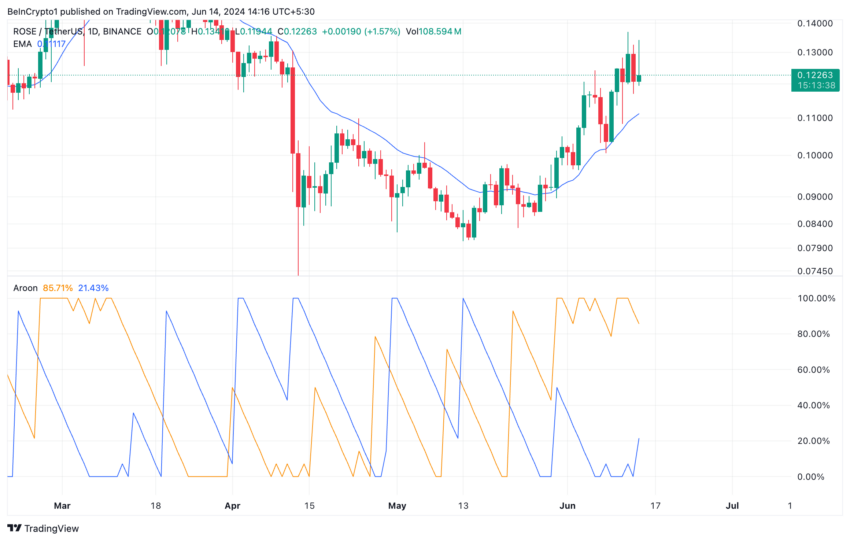 Oasis Analysis. Source: TradingView
If this trend is maintained, ROSE’s value may surge by 8% to trade at $0.13.
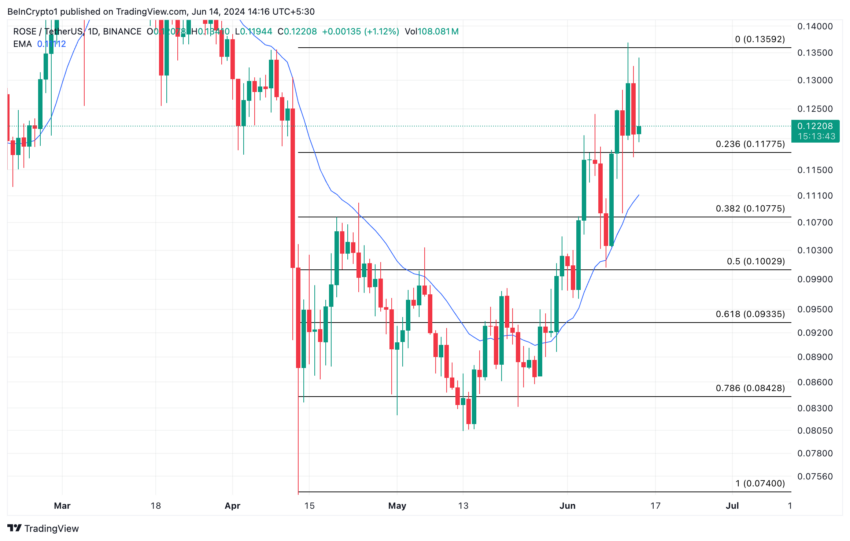 Oasis Analysis. Source: TradingView
However, if invalidated, it will dip to sell at $0.11
Toncoin (TON) Bulls Take Charge
The price of Toncoin (TON), the cryptocurrency linked to the popular messaging app Telegram, has soared by 5% in the past seven days. TON’s daily trading volume has also spiked during the period under review.
As of this writing, TON’s trading volume totals $517 million. The last time the altcoin’s daily trading volume was this high was May 16.
According to TON’s Directional Movement Index (DMI), the bullish sentiment trailing the altcoin is significant. Readings from this indicator show its positive directional index (green) resting above its negative index (red).
An asset’s DMI identifies the direction and strength of a trend. When the positive index lies above the negative index, it confirms the market’s uptrend and suggests that buying momentum exceeds token sell-offs.
TON’s positive Elder-Ray Index confirms its bullish bias. This indicator identifies the direction of an asset’s price trends and potential buying or selling opportunities in the market.
When its value is positive, it is a bullish signal, which suggests that token accumulation outpaces distribution.
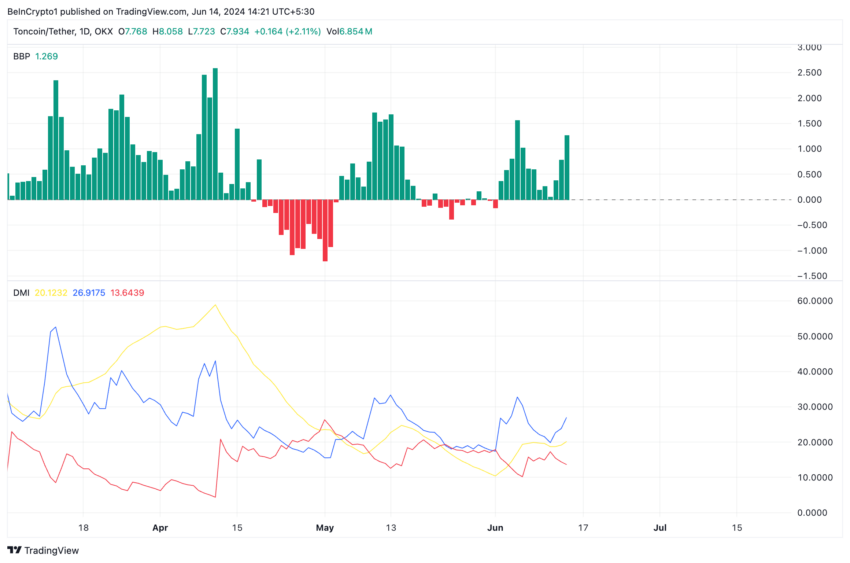 Toncoin Analysis. Source: TradingView
If bullish sentiment continues to grow, TON’s price might rally above $8.05.
Read More: What Are Telegram Bot Coins?
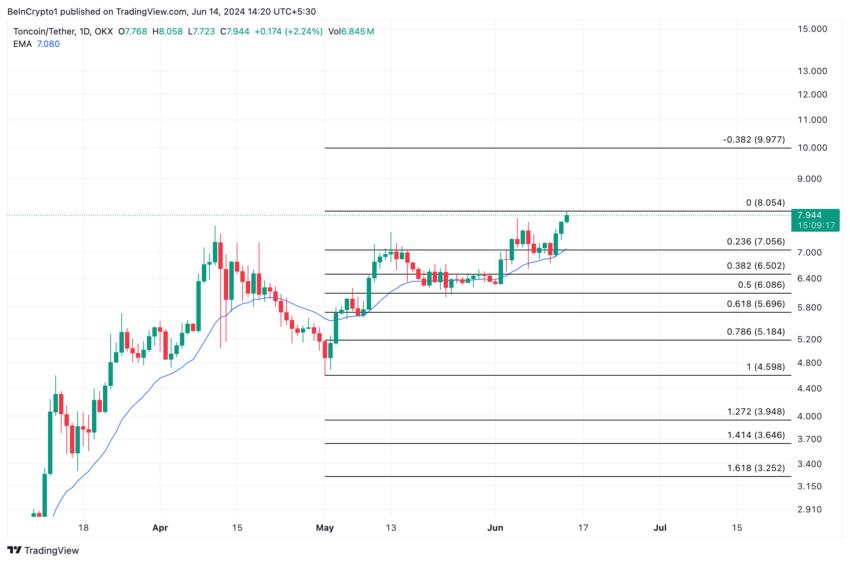 Toncoin Analysis. Source: TradingView
However, if traders begin to take profit and TON sell-off spikes, its price might plummet to $7.05.
Floki (FLOKI) Leads From Behind
Popular meme coin Floki (FLOKI) is the top altcoin with the most losses in the last week. Exchanging hands at $0.00021 as of this writing, the price of the dog-themed token has dropped by 32% in the past seven days.
Its price fall is partly due to the significant whale outflows it witnessed last week. For context, on June 12, FLOKI’s large holder outflow totaled 253 billion FLOKI, valued at $53 million at current market prices.
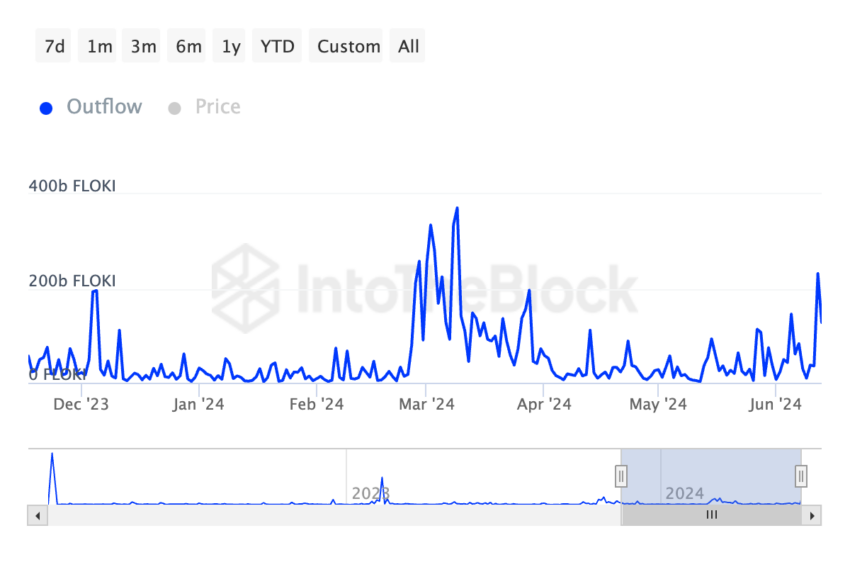 Floki Large Holder Outflows. Source: IntoTheBlock
The meme coin last recorded outflows this high on March 9.
If the demand for FLOKI continues to dip, its value may fall to $0.00020.
Read More: What Are Meme Coins?
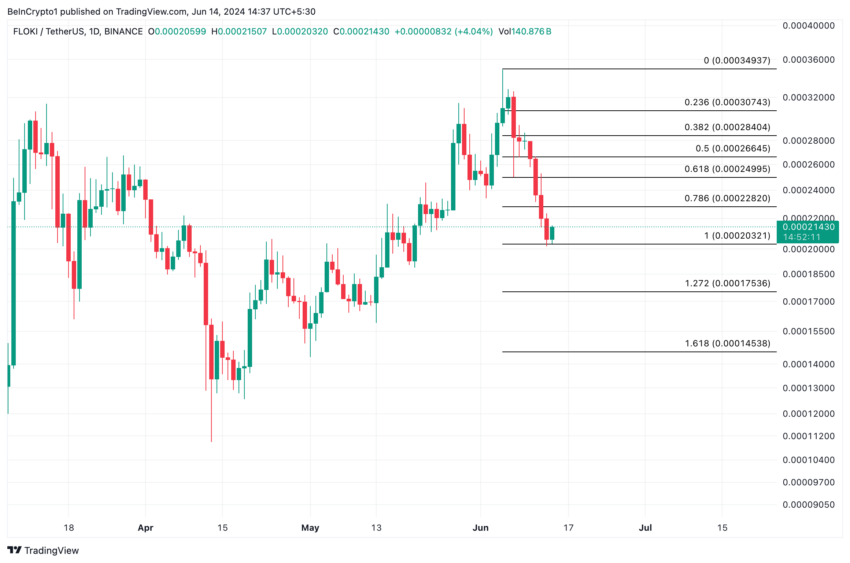 Floki Analysis. Source: TradingView
However, if whale activity sees a resurgence and the general sentiment toward the altcoin turns positive, its price might climb to $0.00022.
Wormhole (W) Puts a 30% Hole in Investors’ Profits
W, the native token of the cross-chain bridge Wormhole, has seen its value drop by 30% in the past seven days. It currently trades at $0.48.
At its current price, the altcoin trades below its 20-day EMA (blue) and its 50-day Small Moving Average (orange).
When an asset’s price trades below these moving averages, it confirms the market downtrend and suggests that the overall trend for the past few months has been negative. Traders often consider this a sign to sell their holdings or open short positions.
If traders intensify their W distribution efforts, its price may drop to $0.46.
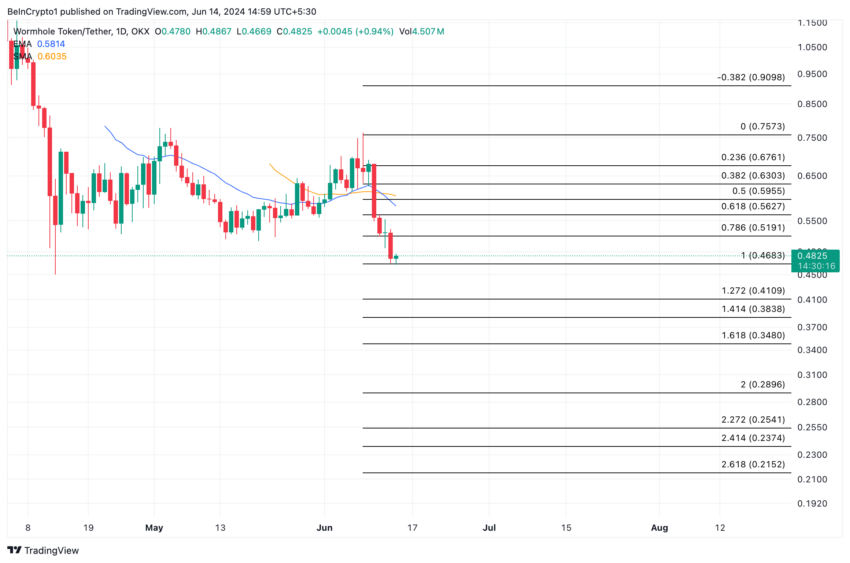 Wormhole Analysis. Source: TradingView
If the trend is reversed and buying momentum increases, the altcoin may rally to $0.51
8d ago•
bullish:
1
bearish:
0
Share


 Manage all your crypto, NFT and DeFi from one place
Securely connect the portfolio you’re using to start.

bullish:
0
bearish:
0

bullish:
0
bearish:
0

bullish:
0
bearish:
0

bullish:
0
bearish:
0