Crypto Market Price Analysis Today: Bitcoin (BTC), Ethereum (ETH), Starknet (STRK), Optimism (OP), Near Protocol (NEAR)
13d ago•

bullish:
1
bearish:
0
Share

Reports of geopolitical tensions between Iran and Israel led to significant fluctuations in Bitcoin’s price in recent weeks. Despite a drop below $60,000, the price quickly recovered, indicating that buyers are attempting to establish $60,000 as a new support level.
Additionally, the eagerly awaited Bitcoin halving event passed with little fanfare, subtly marking a significant milestone in the cryptocurrency sector. On April 19, 2024, the reward for mining a Bitcoin block decreased from 6.25 BTC to 3.125 BTC. Despite the importance of this event, it went largely unnoticed—there were no celebrations, no fireworks, and Bitcoin’s price stayed roughly stable at about $64,000.
With the Bitcoin halving event now over, investors are keen to understand its potential impact on the cryptocurrency’s price and overall market behavior in the upcoming weeks and months. Historical patterns indicate that the journey to new record highs may not be direct.
Traditionally, Bitcoin’s price has increased around each halving, but the ascent has not always been smooth. The reduction in mining rewards may pose challenges for smaller mining operations. Nonetheless, the rising Bitcoin prices prior to the event might mitigate some of the financial strain in the short term.
In today’s market analysis, we’ll explore Bitcoin’s upcoming price targets along with an in-depth technical analysis of trending altcoins.
Bitcoin (BTC) Price Analysis
The price of Bitcoin has experienced a strong recovery over the past 24 hours, climbing from a low of $63,000 and currently stabilizing above $65,000. Despite strong defense at resistance levels by sellers, buyers are aggressively purchasing during price dips.
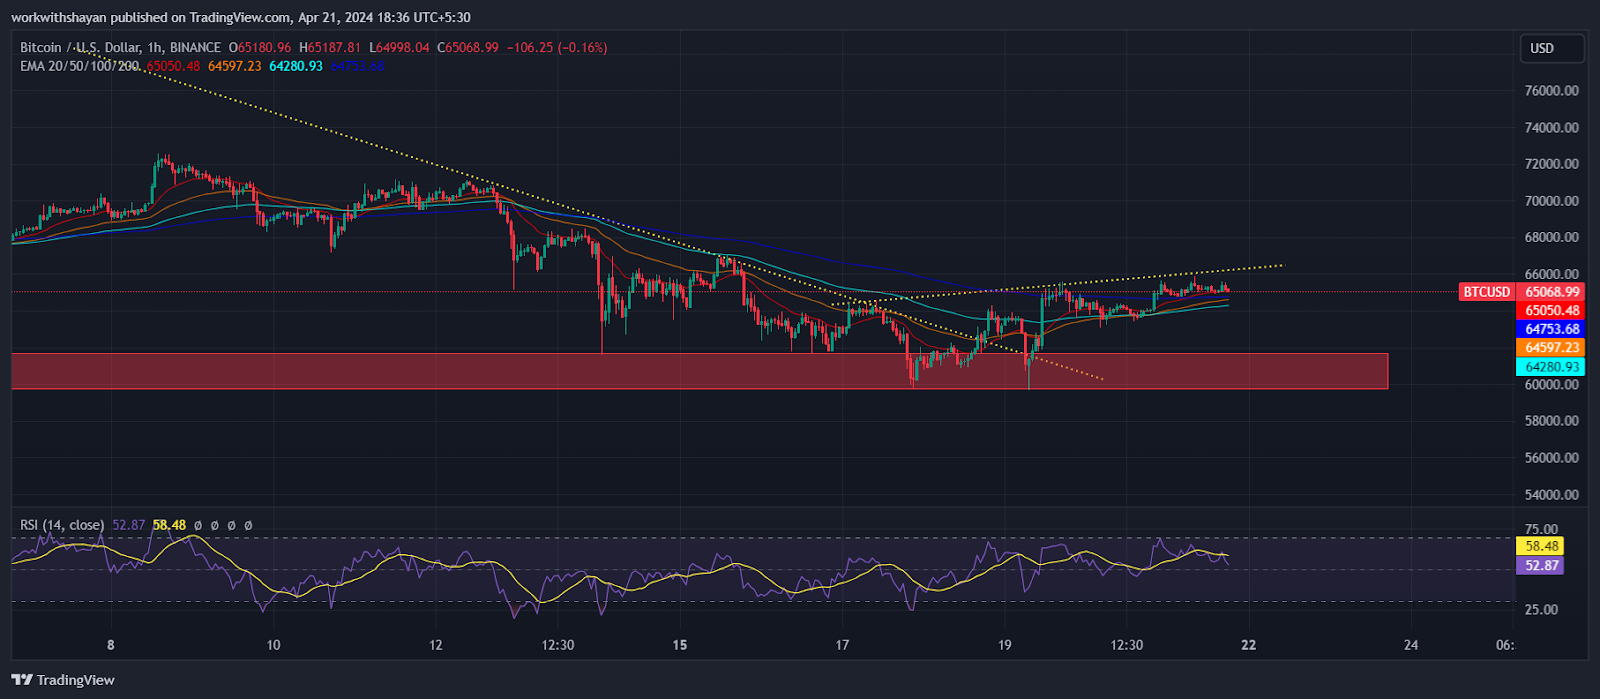
BTC/USDT Chart On Tradingview
Should Bitcoin break through the resistance at $66,000, it may encounter considerable opposition from sellers. A rapid rise past this level could propel the price to over $70,000 next week, approaching the all-time high.
On the other hand, if sellers succeed in driving the price below the moving averages, it indicates that the Bitcoin/USDT pair might remain in a consolidation phase, fluctuating between $65,000 and $60,000 for a while.
Ethereum (ETH) Price Analysis
Sellers attempted to push the price of Ether below the low of $2,800, but the pronounced wick on the candlestick indicates that buyers are actively purchasing at lower prices. As a result, ETH price rebounded and surged above $3.1K.
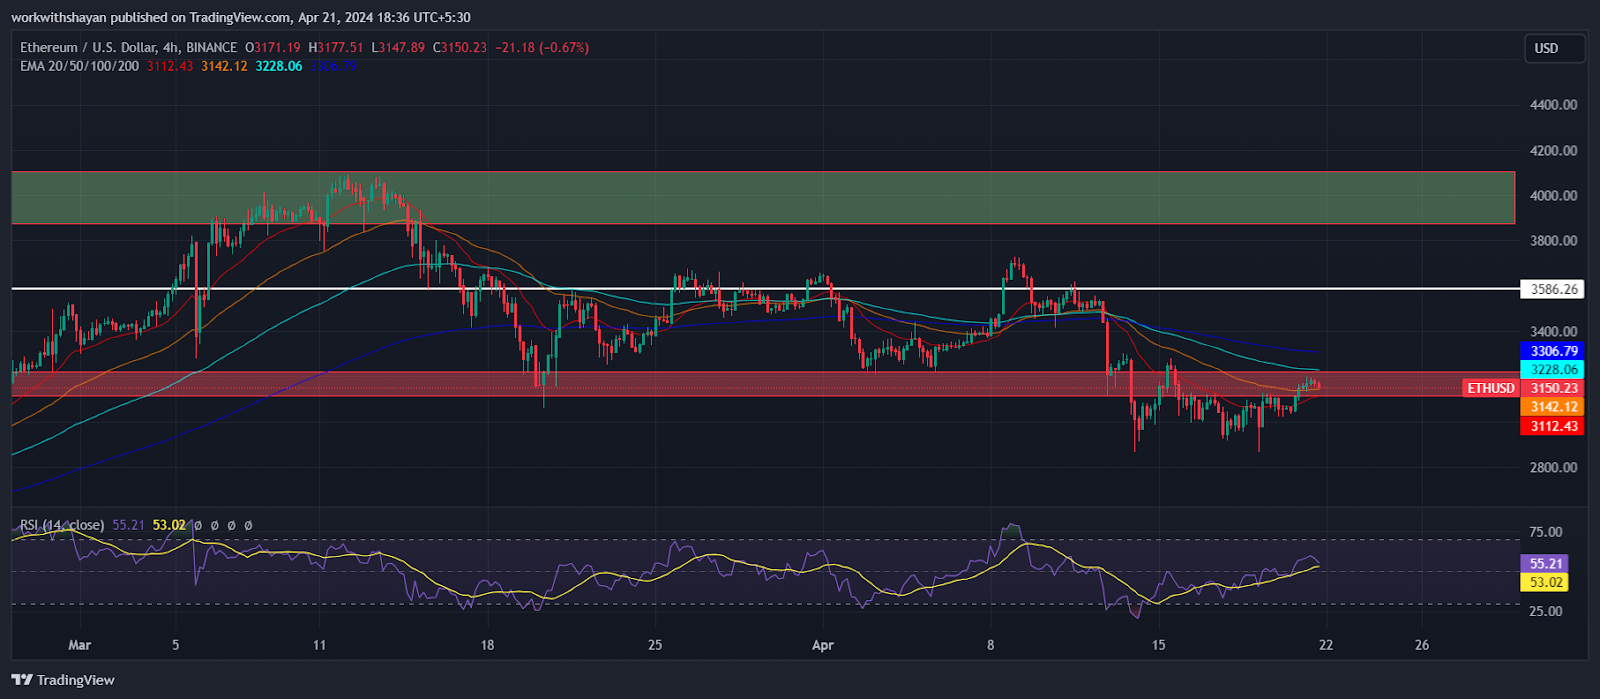
ETH/USDT Chart On Tradingview
The price might reach the 200-day exponential moving average (EMA) at $3,307, where a significant struggle between buyers and sellers is expected. Should the price decline from the 200-day EMA, sellers will likely try again to drive the ETH/USDT pair below $2,800. If successful, the pair could potentially drop to $2,658 and might even fall as low as $2,400.
Conversely, if the price climbs above the 200-day EMA, this could signify that the correction has concluded. The pair would then aim to ascend to the next significant resistance level at $3,586.
Starknet (STRK) Price Analysis
STRK price has been oscillating between $1.3 and $1.15 recently, showing uncertainty among traders about its future direction. However, buyers have an advantage as the RSI level recently surged above the midline.
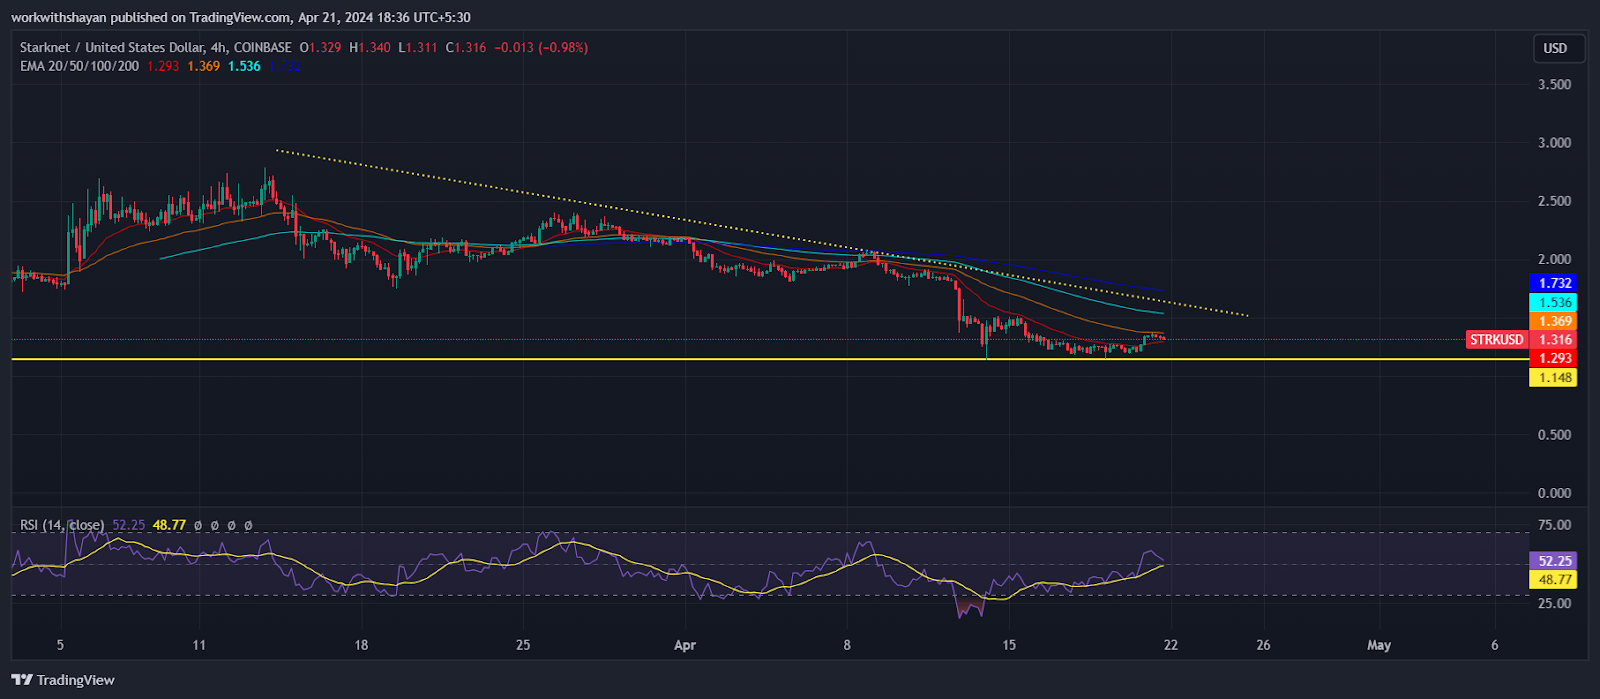
STRK/USDT Chart On Tradingview
Should buyers push past the 200-day EMA ($1.7), the STRK/USDT pair might climb to the key resistance at $2.4. Overcoming this barrier could pave the way for a surge to $2.8.
Conversely, if the price declines and falls beneath $1.15, it could confirm a bearish pattern, potentially triggering a decline to $1.
Optimism (OP) Price Analysis
OP price has consistently found support at $2 recently, indicating strong interest from buyers. In recent hours, the price made strong buying pressure and initiated a recovery rally toward $2.5.
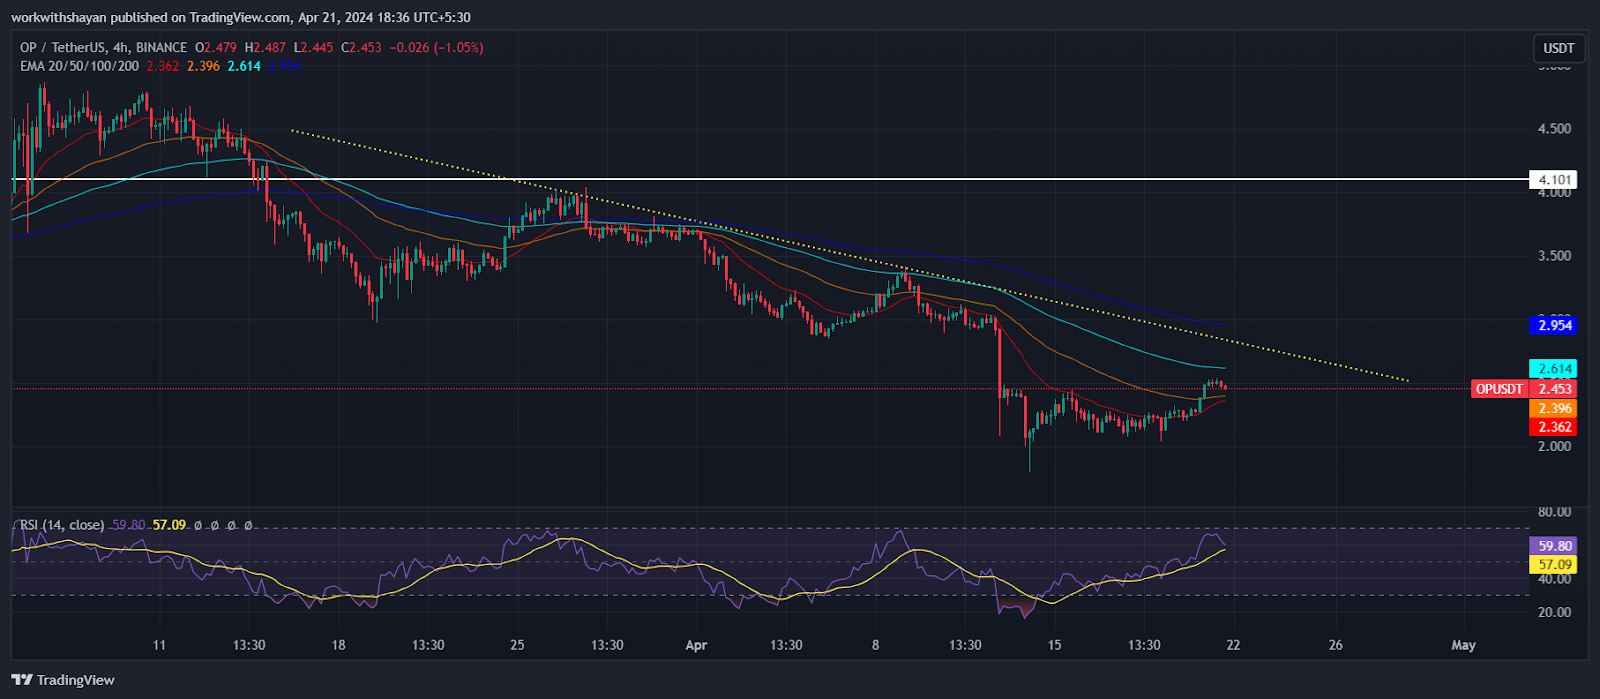
OP/USDT Chart On Tradingview
The price is poised to approach the descending resistance line, a pivotal level to monitor. If OP price reverses sharply from this point, the bears may attempt to push the OP/USDT pair back below $2. Success here could lead to a further decline towards the $1.5 mark.
Alternatively, if the price ascends beyond the 200-day EMA, this would indicate weakening bearish momentum. Although $3.3 may pose resistance, it could be breached, potentially driving the pair towards $4.1.
Near Protocol (NEAR) Price Analysis
Although Near price dipped below the $4.8 support level, it managed to stay above the $4.3, due to strong buying interest. As a result of strong accumulation, NEAR price skyrocketed toward $6, aiming to break above immediate Fib channels.
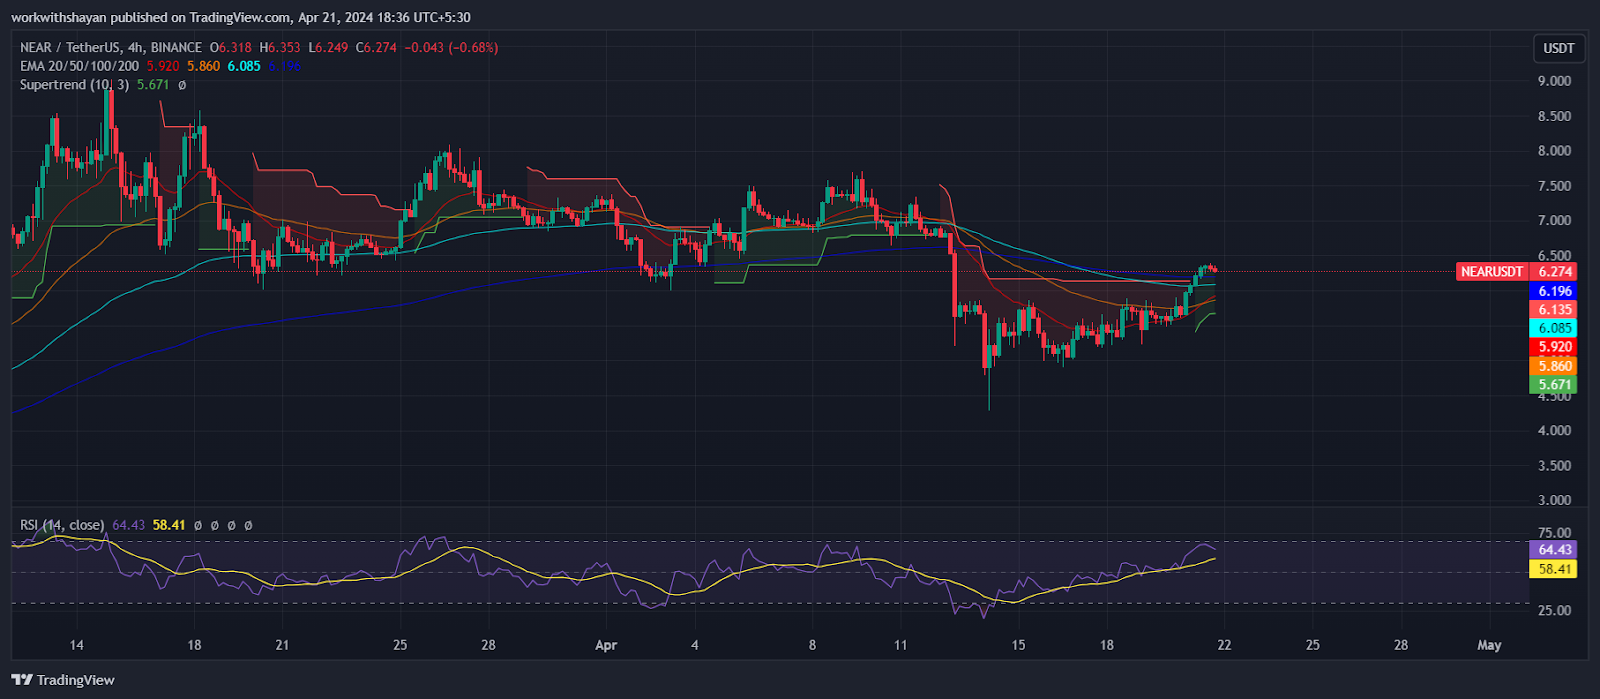
NEAR/USDT Chart On TradingView
This resistance to further declines might entice buyers to attempt pushing the price toward the $7. However, if the price sharply reverses at the 200-day EMA, it could indicate that the upward movements are being met with selling pressure, potentially driving the price back down to the support range of $5.5 to $4.4. A drop below this range could lead to a decrease to $4.
On the other hand, if buyers manage to send the price above the $7 mark, it could signal an end to the current correction phase. In such a scenario, the NEAR/USDT pair might aim for a surge toward the 50-day SMA at $8.2.
13d ago•
bullish:
1
bearish:
0
Share


 Manage all your crypto, NFT and DeFi from one place
Securely connect the portfolio you’re using to start.

bullish:
0
bearish:
0


bullish:
0
bearish:
0