
SUI Price Forecast August 2026: Key Levels, Breakdown, or Recovery?

0
0

$SUI is cooling off from its recent highs even as the network keeps racking up strong fundamentals in the background.
$Sui is a Layer 1 blockchain built for high throughput and low latency using an object-centric data model, positioning itself for both DeFi and real-world asset use cases.
This SUI price forecast august 2026 looks at whether $SUI can reclaim $0.7256 over the next few sessions Here's the full breakdown.
SUI Market Overview
Metric | Value |
Price | $0.6902 |
24h Change | +1.03% |
Market Cap | $2.79B (+1.03%) |
Unlocked Market Cap | $2.79B |
24h Volume | $153.68M (−31.61%) |
Vol/Mkt Cap (24h) | 5.57% |
FDV | $6.89B |
Total Supply | 10B SUI |
Max Supply | 10B $SUI |
Circulating Supply | 4.05B $SUI |
Profile Score | 87% |
Source: Data from CoinMarketCap as of 29/07/2026. Figures may vary slightly across other tracking websites.
Bullish Sui Network Updates You May Have Missed
Data from BSCNews rounded up several fundamental data points worth noting. The Sui Layer 1 blockchain has now hit 4.53 billion cumulative transactions, per Chainspect data.
Suilend Protocol has crossed $10 million in USD-SUI deposits on its main market, with investors drawn by a yield near 10% APY.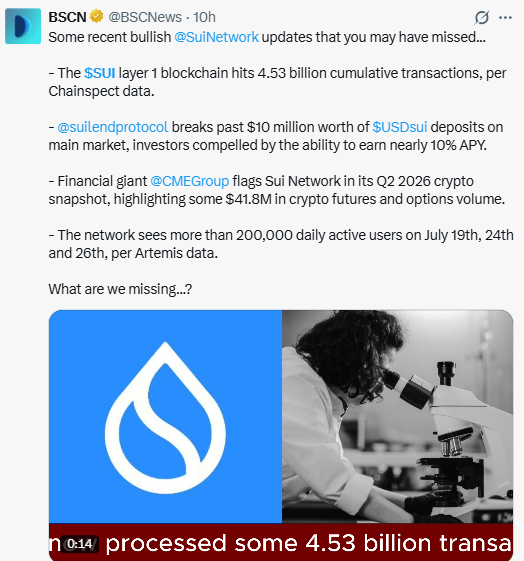
CME Group flagged Sui Network in its Q2 2026 crypto snapshot, highlighting roughly $41.8M in crypto futures and options volume tied to the network.
Daily active users have also topped 200,000 on three separate days this month (July 19th, 24th, and 26th), per Artemis data. Together, these point to genuine usage growth alongside the price action.
Sui Technical Analysis: Key Support and Resistance Levels
Pair: $SUI/USDT · Market: Spot (Binance) · Timeframe: 4H · Source: TradingView · Timestamp: July 29, 2026, 16:57 UTC+5:30
SUI trades at $0.6902, up 0.33% on the candle, after pulling back sharply from a mid-July high near $0.78, where price had repeatedly failed to break through a supply zone.
The pullback broke below the long-standing rising trendline drawn from late June's low, and price is now trading below both the EMA 20 ($0.6986) and EMA 50 ($0.7163), which sit as overhead resistance. RSI (14) at 40.52 is below neutral. Reflecting the recent selling pressure without yet being oversold. A "liquidity" zone marked near $0.6617 corresponds to the same late-June low that the trendline originated from, making it a level worth watching on any deeper retest.
Level Type | Price | Label |
Resistance 3 | $0.7800 | Top of prior supply zone |
Resistance 2 | $0.7256 | Bottom of prior supply zone |
Resistance 1 | $0.6972 | Recent swing high |
Immediate Price Reference | $0.6902 | Current price |
First Confirmed Support | $0.6788 | Recent higher low |
Deeper Support | $0.6617 | Liquidity zone / trendline origin |
SUI Price Prediction: Bull Case vs. Bear Case
Bull case: If SUI holds above $0.6788 and reclaims the EMA 20/50 cluster near $0.6986–$0.7163, the next target is $0.7256, with a stretch move toward the $0.7700–$0.7900 supply zone if buyers push through with volume.
Bear case: A confirmed break below $0.6788 would open a retest of the $0.6617 liquidity zone, and a failure to hold there could accelerate selling given that this level also marks the origin of $SUI's broader uptrend line.
Can $SUI Reach $0.7800?
It's possible but requires $SUI to first reclaim the EMA cluster and clear $0.7256 with rising volume.
From there, the $0.7700–$0.7800 zone has already rejected price once this month, so a second attempt would need stronger momentum and higher volume than the first breakout attempt to succeed.
What Happens If Support Breaks?
A confirmed close below $0.6788 would be the first bearish signal, and a deeper break below the $0.6617 liquidity zone would suggest the broader uptrend structure since late June is at risk of failing, opening room for a larger correction.
Expert View
According to CoinGabbar analysts, $SUI setup is a case of price and fundamentals temporarily diverging.
On-chain activity, daily active users above 200,000, growing USD stablecoin deposits, rising cumulative transactions, and institutional attention from CME Group all point to a network that's genuinely growing usage.
But the chart shows a market correcting after a failed breakout attempt near $0.78, and RSI at 40.52 suggests sellers currently have the upper hand short-term.
The key question is whether strong fundamentals eventually pull price back up to retest resistance or whether the technical pullback deepens first.
Disclaimer: This article is for informational purposes only and should not be treated as investment advice. Cryptocurrency markets are highly volatile, and readers should conduct their own research before making any financial decisions.
0
0

 Manage all your crypto, NFT and DeFi from one place
Securely connect the portfolio you’re using to start.

0
0

0
0


0
0