Dogecoin Price Signals Strength As Wallets and Volume Spike Together

0
0

After months of consolidation, Dogecoin price is making noise again. And this time, the signals look more convincing than ever.
In 2025, DOGE has had a slow but steady recovery, with the price now hovering near $0.199, just under a key breakout zone.
The meme coin’s price action is now being supported by rising trading volumes, surging wallet activity, and bullish technical signals that analysts say could spark a new leg higher.
Let’s break down the story behind DOGE’s momentum.
$1 Billion Volume Spike Brings Hope For Dogecoin Price
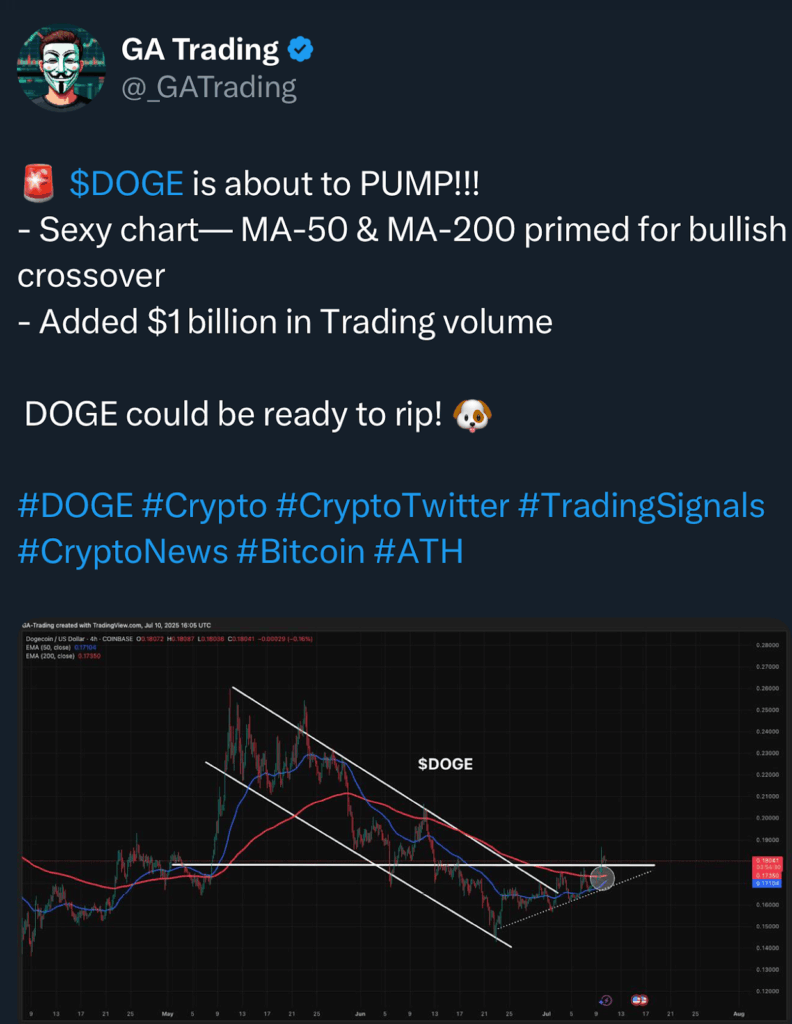
The most immediate trigger is the surge in trading activity. In the last 24 hours, Dogecoin added over $1 billion in trading volume, according to analyst GA Trading.
Volume spikes often accompany major breakouts, and DOGE’s current move out of a descending triangle aligns with that thesis. Do note that the breakout was in the 4-hour timeline.
This move follows a quiet but meaningful recovery across 2025. After hitting a low during the June correction, DOGE price slowly clawed back toward the $0.18–$0.19 range.
That climb lacked headlines, but now, with attention returning, DOGE may finally be ready to rip.
Holder Count Surge Adds Conviction
Another underappreciated factor is the meme coin’s holder count, which jumped massively in May during a one-day surge.
While it has cooled off slightly since, the number of wallets holding DOGE remains among the highest for 2025.
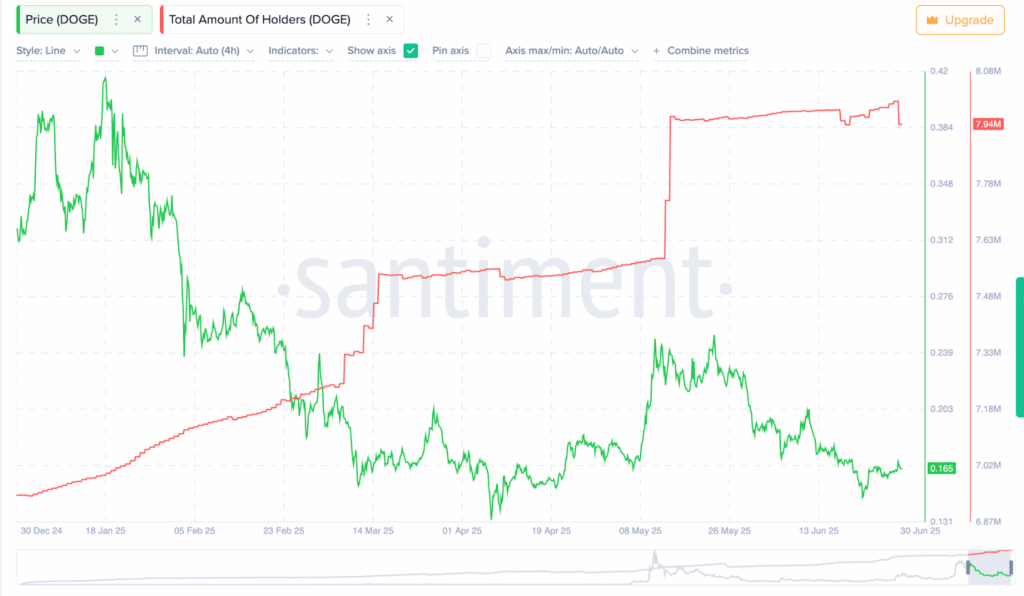
A growing holder base shows confidence, not just speculation. Even as prices drifted sideways in June, wallets didn’t exit.
This long-term holding behavior strengthens the floor for the Dogecoin price, especially when combined with surging short-term volume.
However, the one-day holder count surge in May was something that might have positively biased the long players.
RSI Shows Hidden Bullish Divergence
Looking under the hood, the Relative Strength Index (RSI) is sending a bullish signal. RSI measures price momentum; anything above 70 is overbought, and anything below 30 is oversold.
But sometimes, it gives hidden clues.
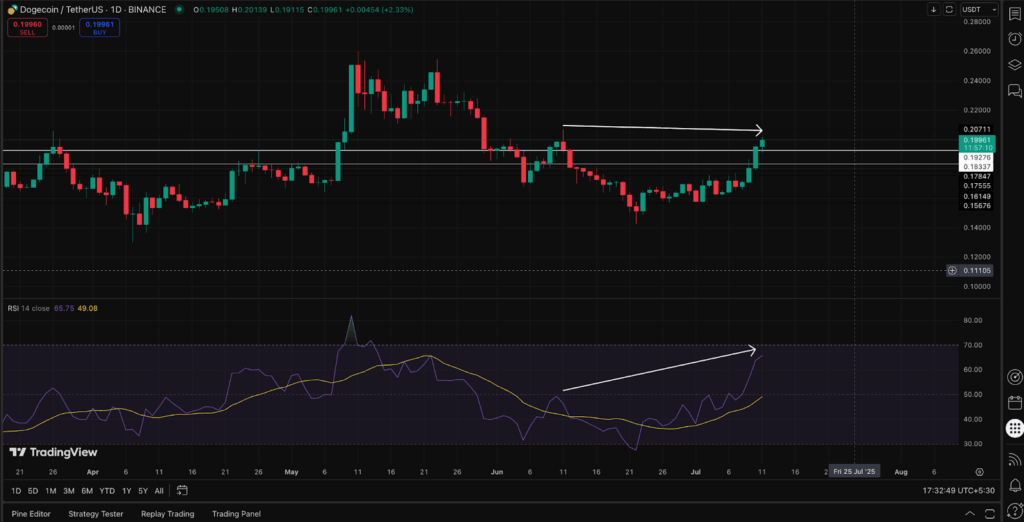
Currently, while the DOGE price has made lower highs, RSI has made higher highs. This is known as hidden bullish divergence, a signal that momentum is building even if the price hasn’t broken out yet. RSI now sits in the 65–68 zone; not yet overbought, suggesting there’s still room to run.
This divergence suggests bulls are preparing to drive the meme coin higher if the price breaks above the next resistance.
RSI is a momentum oscillator that tracks the strength of recent price changes to identify overbought or oversold conditions.
Fibonacci Levels Show Clear Breakout Targets for Dogecoin Price
The price chart shows a textbook trend-based Fibonacci setup. The Fibonacci levels are drawn from the April swing low to the May high and then retraced after the June dip.
This gives us three important levels to watch now:

- First resistance: $0.20725, the immediate breakout zone
- Second target: $0.22983, aligned with a previous rejection in early May
- Third target: $0.25250, the extension point if the rally holds
Fibonacci levels are tools used to predict potential resistance and support zones based on past price swings. Since Dogecoin price has little historical resistance between these levels, breakouts tend to be sharp, while failures can drop fast.
Interestingly, the chart also hints at a possible cup formation, a bullish pattern, but the handle hasn’t formed yet. Until that happens, the safer bet is to focus on the triangle breakout and Fibonacci zones.
The Dogecoin price is showing real momentum. A combination of $1B in volume, rising holders, and bullish RSI divergence is lining up with a clean Fibonacci breakout structure.
The meme coin has already cleared key trendlines on the 4-hour chart, with MA-50 and MA-200 approaching a bullish crossover.
The post Dogecoin Price Signals Strength As Wallets and Volume Spike Together appeared first on The Coin Republic.
0
0


 Manage all your crypto, NFT and DeFi from one place
Securely connect the portfolio you’re using to start.


0
0