
Shiba Inu Price Prediction: SHIB's Triple Breakout Faces Its Big Test

0
0
Shiba Inu, the Ethereum-based memecoin that launched in 2020 as a self-proclaimed "Dogecoin killer," has since built out its own ecosystem, including Shibarium and a token burn mechanism.
It currently trades around $0.00000564, up sharply on the day.
This Shiba Inu price prediction breaks down where SHIB could head next based on chart structure, burn activity, liquidation data, and exchange flows.
Live Market Data
Metric | Value |
Price | $0.00000564 |
24h Change | +12.9% |
24h Range | $0.00000522 - $0.00000622 |
$3.317B | |
Fully Diluted Valuation | $5.629B |
24h Trading Volume | $342.603M |
Circulating Supply | 589.239T |
Total Supply | 589.496T |
Source: $SHIB market cap data taken from Coingecko, data as of Aug 22, 2026. Figures may vary slightly across other tracking websites.
Liquidation Snapshot
Window | Total Liquidated | Longs | Shorts |
1 Hour | $551.33K | $507.58K | $43.76K |
4 Hour | $570.89K | $519.50K | $51.39K |
12 Hour | $1.02M | $753.16K | $269.67K |
24 Hour | $1.18M | $858.53K | $318.03K |
Source: Liquidation Data Taken From Coinglass.
Longs have absorbed the overwhelming majority of liquidations in every window, roughly two-thirds or more of the total each time.
That's a bit unusual on a day $SHIB is up double digits, and it lines up with the pullback into the support retest zone rather than a clean uninterrupted rally.
Exchange Volume
Futures activity in SHIB is led by OKX, which alone clears $120.48M in 24-hour volume, more than double the next closest venue.
LBank and MEXC follow closely around the $59M mark, with Bitget, Gate, Bitunix, and KuCoin rounding out the mid-tier exchanges. 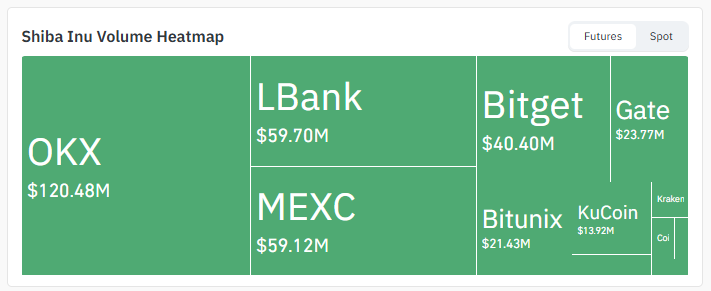
Source: Volume Heatmap Data Taken From Coinglass.
This spread across multiple venues supports the idea that the current move in this Shiba Inu price prediction isn't confined to a single thin order book.
Social Sentiment of $SHIB
Exchange Flow Watch A recent flow report flagged a substantial increase in $SHIB moving onto exchanges, describing it as predictable given the overall volatility spike. 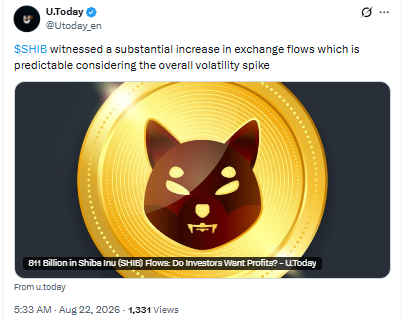
Source: Data Taken From @Utoday_en, X Account.
Large inflows to exchanges are often read as a precursor to profit-taking, so this is worth watching alongside the current support retest.
Token Burn
The $SHIB Burn tracker shows no tokens burned in the most recent hour, but the 24-hour burn total sits at 22,625,642 SHIB, up 177.68% from the prior day. 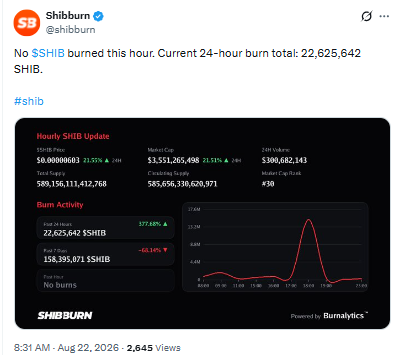
Source: Data Taken From @shibburn, X Account.
The 7-day burn figure, however, is down 63.14%, meaning burn activity has been lumpy rather than steady.
Circulating supply stands at roughly 585.66 trillion SHIB against a total supply near 589.16 trillion, so burns continue to trim the float, just not at a consistent pace day to day.
Key Takeaways
SHIB trades near $0.00000564, up 12.9% over 24 hours, after clearing two descending channels and a falling trendline on the daily chart.
Price is now retesting the breakout zone near $0.00000532, a level that decides the next leg for this Shiba Inu price prediction.
A fair value gap sits just below current support, meaning a breakdown could see a price dip to fill that gap before any recovery attempt.
Long positions have taken the bulk of liquidations across every timeframe; it is unusual for a day SHIB is still up double digits.
SHIB burn rate jumped 177.68% in the past 24 hours even as exchange inflows rose, a mixed signal worth watching.
Technical Analysis
Daily Chart: Double Breakout Meets Support Retest
SHIB's daily chart has done a lot of work lately. Price was stuck inside a descending channel, broke out of it, then went ahead and formed another descending channel right after, breaking out of that one too.
On top of that, a longer falling trendline that had capped price for weeks also gave way. 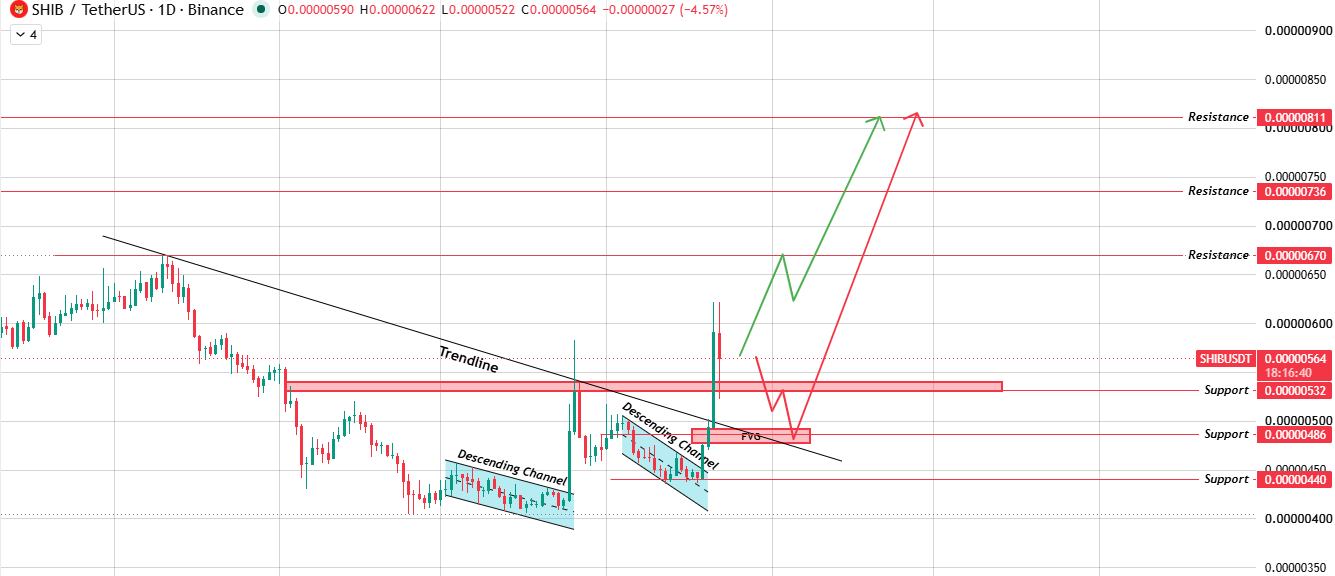
Source: Chart Taken From TradingView.
That's three separate breakout signals stacking on the same chart, not a small thing for a Shiba Inu price prediction.
Now price has pulled back to test the zone around $0.00000532, the same area where the trendline break and channel breakout converged.
From here, two paths are live. A bounce keeps the bullish structure intact and opens the door toward $0.00000670 and beyond.
A breakdown sends the price into the FVG sitting just below, where a gap fill followed by a bounce attempt is the more likely outcome rather than a straight collapse.
Support and Resistance Levels
Level Type | Price |
Resistance 3 | $0.00000811 |
Resistance 2 | $0.00000736 |
Resistance 1 | $0.00000670 |
Current Price | $0.00000564 |
Support / Retest Zone | $0.00000532 |
FVG Zone | $0.00000486 - $0.00000500 |
Major Support | $0.00000440 |
Bull, Base, and Bear Case
Scenario | Setup | level | Invalidation |
Bull | Support at $0.00000532 holds, and the price bounces. | $0.00000670 - $0.00000811 | Below $0.00000486 |
Base | Price chops between support and the FVG zone before committing | $0.00000532 - $0.00000600 | Break of $0.00000440 |
Bear | Support breaks, price dips to fill the FVG | $0.00000486 - $0.00000500 | Below $0.00000440 |
Glossary
Descending Channel: A price structure formed by two parallel downward-sloping lines. Breaking out of the top of this channel is generally read as an early bullish signal, especially when it happens more than once in a row like it has here.
Fair Value Gap (FVG): A price zone where the market moved so fast that it left a visible gap in trading activity. Price often revisits these gaps later to "fill" them before deciding its next direction, so traders watch them as magnet zones.
Falling Trendline: A downward-sloping line connecting a series of lower highs. When the price finally closes above it, that's often treated as the first sign a downtrend is losing steam.
Token Burn: The permanent removal of tokens from circulating supply, usually by sending them to an address nobody can access. For SHIB specifically, burn totals are tracked hourly, daily, and weekly by community dashboards.
Liquidation: When a leveraged trading position gets forcibly closed because losses exceed the trader's margin. A cluster of long liquidations during a pullback usually means late buyers got caught on the wrong side of a dip.
Exchange Inflow: Tokens being deposited onto centralized exchanges from private wallets. Rising inflows are frequently associated with holders preparing to sell or trade, though it isn't a guarantee of selling pressure on its own.
Methodology
This Shiba Inu price prediction is built from daily chart technical analysis, live burn data from Shibburn, exchange flow reporting, liquidation and futures volume data from Coinglass, and current market data.
All price levels referenced come directly from the chart provided, with no extrapolated or speculative levels.
Disclaimer: This article is for informational purposes only and does not constitute financial, investment, or trading advice. Cryptocurrency markets, including Shiba Inu, are highly volatile and speculative. Any price levels, levels, or scenarios discussed are probability-based observations drawn from technical and on-chain data, not guarantees. Please conduct your own research and consult a qualified financial advisor before making investment decisions.
0
0


 Manage all your crypto, NFT and DeFi from one place
Securely connect the portfolio you’re using to start.


