
Ethena Price Prediction: Bull Trap or Massive Breakout?

0
0

Ethena price prediction searches are picking up after $ENA pulled off a move that caught a lot of traders off guard.
The coin briefly broke its own rising trendline, the kind of move that usually signals trouble, and then reversed hard enough to punch through the old swing high. It just could not close above it. That tension is exactly what this setup is built around.
Technical analysis prepared by CoinGabbar's crypto research desk. This piece is for informational purposes only and is not financial advice. CoinGabbar and the analyst do not hold a position in ENA at the time of publication.
The levels described here apply strictly to the 4-hour timeframe covered and should be rechecked if the price closes beyond the stated range.
ENA Trend and Momentum: Key Takeaways
ENA broke its ascending trendline briefly but reversed instantly instead of confirming a lower low
Price pushed through the old swing high but has not closed above it yet
A sustained close above the $0.0925 to $0.0941 zone opens $0.0985, then $0.1043, then $0.1184
A close below $0.0770 instead shifts focus to $0.0697 support
Shorts dominated liquidations across every window over the past 24 hours
Ethena Price Right Now
Metric | Value |
Price | $0.0915 |
24h Change | +1.48% (+$0.0013) |
Market Cap | $870.50M |
Futures Volume (24h) | $313.08M |
Spot Volume (24h) | $55.75M |
Open Interest | $215.52M |
Circulating Supply | 9.56B $ENA |
Total Supply | 15.00B $ENA |
Max Supply | 15.00B $ENA |
Open interest is the total value of $ENA derivative contracts still open across exchanges, a rough gauge of active leveraged positioning.
Chart source: ENA/USDT 4-hour perpetual contract, TradingView, Binance data feed, captured August 4, 05:17 PM IST (11:47 AM UTC).
Market cap, volume, and supply data from Ethena market data on CoinGlass were captured the same day.
Ethena Price Forecast Methodology and Data Sources
This read uses the ENA 4-hour chart for structure, with volume, open interest, and market cap figures from CoinGlass, and liquidation flow from the Ethena liquidation tracker.
Levels are only treated as invalidated on a confirmed closing candle beyond the stated trigger, not an intraday wick. For the fuller monthly picture beyond this single setup, see the Ethena monthly price outlook.
Ethena Liquidation Snapshot
Liquidations lean heavily toward shorts across every timeframe.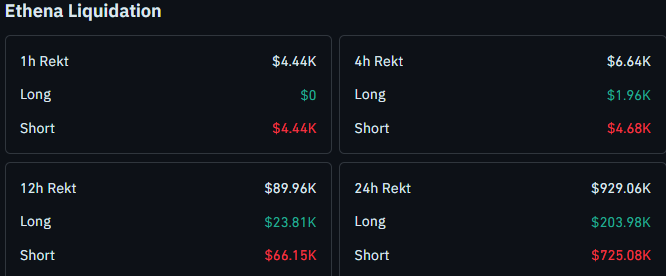
The 1-hour window shows $4.44K wiped out, all from shorts with nothing from longs.
The 4-hour window shows $6.64K total, with $4.68K from shorts against $1.96K from longs.
The 12-hour window shows $89.96K total, $66.15K from shorts versus $23.81K from longs.
Across the full 24 hours, liquidations hit $929.06K, with shorts accounting for $725.08K of that and longs making up $203.98K.
That kind of one-sided short unwind often shows up right around a level like this one, a question also explored in whether today's jump is a bull trap or a genuine trend shift.
Source: ENA liquidation data, CoinGlass, checked August 4, around 05:17 PM IST.
Is ENA Breaking Down or Setting Up a Reversal?
Is this a real breakdown or a trap? So far it looks like the latter.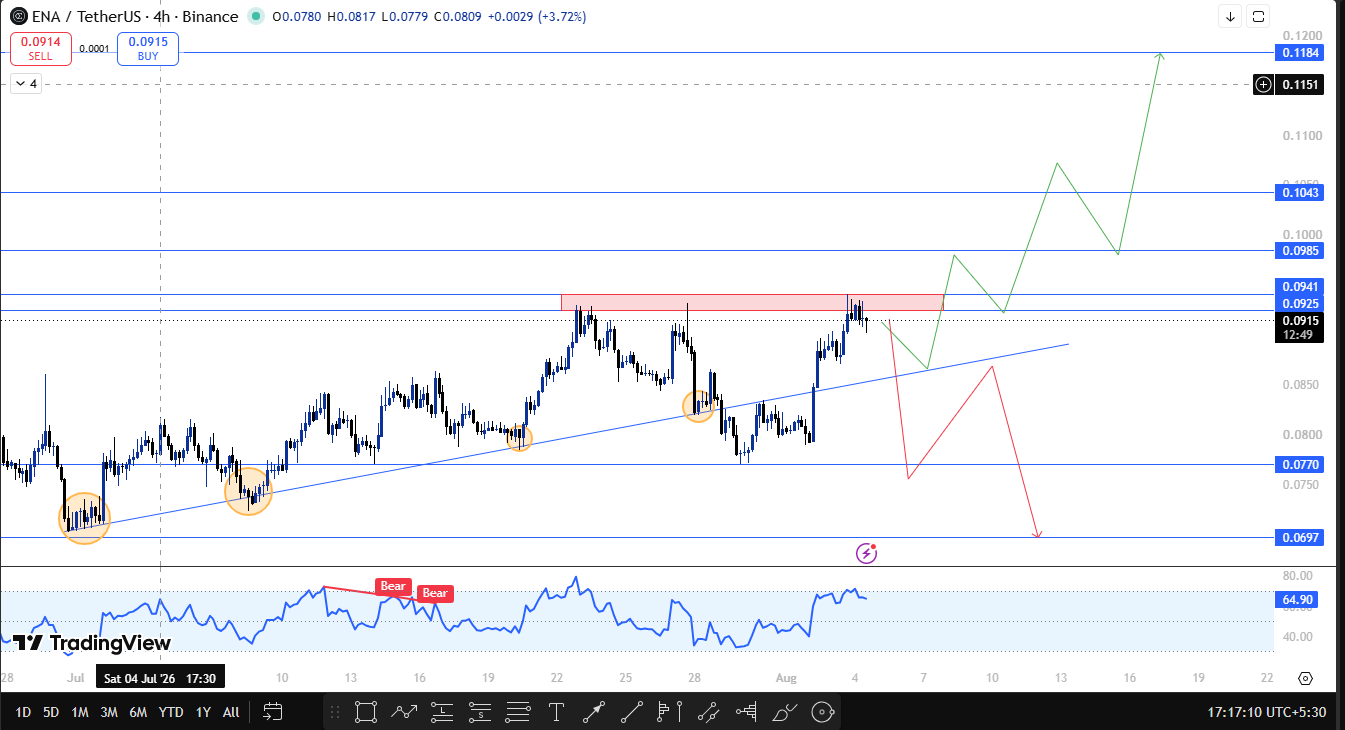
ENA briefly closed below its ascending trendline, the kind of move that should produce a fresh lower low if the breakdown were genuine.
Instead, the price reversed almost immediately and pushed straight back through the previous swing high, though it has not yet closed above that level on a confirmed candle.
That failure to follow through on the downside, paired with an equally fast reclaim attempt on the upside, is the core tension in this Ethena price prediction right now.
ENA is currently fighting through a resistance zone between $0.0925 and $0.0941, the same area that has capped the price on this move so far.
If $ENA sustains above that zone with a confirmed close, the next resistance is $0.0985, followed by $0.1043, and then an extended target of $0.1184, a path also mapped out in whether $ENA is ready for a major breakout.
If instead the price breaks and closes below $0.0770, the next support comes in at $0.0697.
The chart's momentum oscillator RSI is currently reading 64.90, having eased off two earlier Bear tags without printing a fresh one during this latest swing, suggesting the underlying trend has not turned decisively negative despite the trendline scare.
ENA Trend Prediction: Technical Outlook Snapshot
Indicator | Signal |
Trend | The ascending trendline briefly broke, then reversed without a lower low. |
Structure | Testing the $0.0925 to $0.0941 resistance zone, no confirmed close above it yet |
Momentum Oscillator RSI | Reading 64.90, no fresh Bear tag on this latest move |
Liquidations | Shorts dominated every window over the past 24 hours |
Ethena Support and Resistance Levels to Watch
Type | Level | Note | % From CMP |
Extended Target | $0.1184 | Reachable only after clearing $0.1043 | +29.40% |
Resistance 3 | $0.1043 | Third target on continuation | +13.99% |
Resistance 2 | $0.0985 | Second target after the zone clears | +7.65% |
Resistance Zone | $0.0925 to $0.0941 | Current battle zone, needs a sustained close-above | +1.09% to +2.84% |
Current Price | $0.0915 | Fighting through the resistance zone | - |
Support 1 | $0.0770 | Breakdown trigger on a closing basis | -15.85% |
Support 2 | $0.0697 | Next support if $0.0770 fails | -23.83% |
Risk-Reward Table
Case | Trigger | Target |
Bull Case | Sustains a close above $0.0941 | Move toward $0.0985, then $0.1043, then $0.1184. |
Bear Case | Closes below $0.0770 | Slide toward $0.0697. |
What Would Change This Ethena Price Outlook?
The setup stays undecided while ENA trades inside the $0.0770 to $0.0941 range. A confirmed close above the resistance zone validates the reversal.
While a close below $0.0770 would suggest the earlier trendline break was the real signal after all, a scenario also weighed in on whether this start of a bearish trend is finally underway.
Given how sharp the reversal off the trendline was, false moves in either direction are a real risk here, and leveraged positions near either trigger should account for that.
How Bitcoin Sentiment Could Move$ENA Higher
This setup is built off ENA's own chart, but Bitcoin still tends to set the tone for how far a reversal like this can extend.
A steadier Bitcoin tape generally supports the case toward $0.0985 and $0.1043 and plays into whether the extended $0.1184 target and the broader question of whether $ENA can reach five dollars over a much longer horizon stay realistic.
A weaker Bitcoin backdrop raises the odds ENA stays capped below the resistance zone even if the immediate bounce holds.
When This Ethena Price Prediction Gets Revisited
This Ethena price prediction will be revisited on a confirmed close above $0.0941 or below $0.0770, or if no clear direction is confirmed within 24 hours of publication.
Readers can also track whether $ENA will stabilize after the fall for a longer-term view on this recovery attempt.
Ethena Glossary
Ascending Trendline: An upward-sloping line connecting successive higher lows, used to track support during an uptrend.
Swing High: A recent peak in price that acts as a reference point for resistance until it is cleared.
Open Interest: The total value of derivative contracts still open and unsettled.
Liquidation: The forced closing of a leveraged position when a trader runs out of margin.
Ethena Price Prediction: Bull, Base, and Bear Case
Bull Case: A sustained close above $0.0941 opens $0.0985, then $0.1043, with $0.1184 possible if broader sentiment and Bitcoin cooperate.
Base Case: $ENA keeps chopping between $0.0770 and $0.0941 as the market decides whether the trendline scare or the sharp reversal was the real signal.
Bear Case: A close below $0.0770 confirms the earlier breakdown and shifts focus to $0.0697.
Disclaimer
This Ethena price prediction is based on technical chart analysis and market data available at the time of writing. Cryptocurrency markets are highly volatile, and prices can change rapidly. This content is for informational purposes only and should not be considered financial advice. CoinGabbar and the analyst do not hold a position. Always do your own research and consult a qualified financial advisor before making any investment decisions.
0
0

 Manage all your crypto, NFT and DeFi from one place
Securely connect the portfolio you’re using to start.

0
0


0
0

0
0