Bearish Flag Fluttering Over XRP Price: It May Reach $0.5 if This Trade Plays Out Well
30d ago•

bullish:
0
bearish:
0
Share
The post Bearish Flag Fluttering Over XRP Price: It May Reach $0.5 if This Trade Plays Out Well appeared first on Coinpedia Fintech News
While the broader markets are trying hard to fight the bearish influence, XRP prices do not appear to have followed the trend. The March trade remained consolidated within a narrow range but at the start of the month, was extremely bearish. The levels slipped from the consolidated zone around $0.62 and dropped by over 8% to reach levels around $0.58. While the traders expect a bullish rebound, they may face another bearish heat soon.
The price entered a rising channel, where it rose to the support level, but with another bounce, it fell back to the support line of the channel. Further, the trade set-up flipped and experienced an upward impulse to the resistance level, thereby breaking the $0.5665 support zone. This caused a steep correction and a repeated upward impulse to $0.7440, breaking $0.6630 and exiting from the channel.
Now that the trade has headed towards the lower support of the triangle after breaking the resistance, will the bulls manage to hold the support?
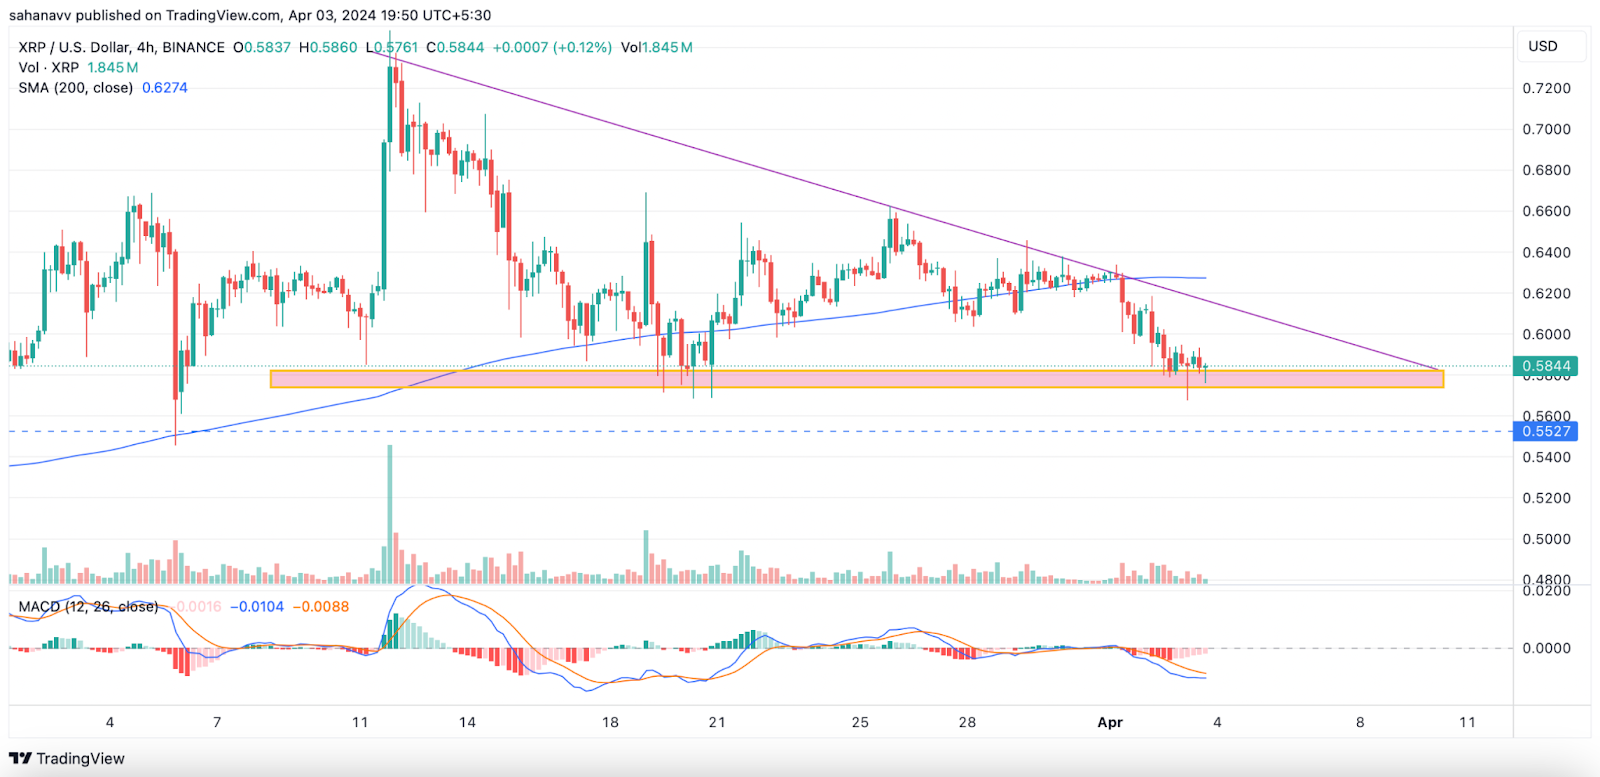
As mentioned above, the XRP price has reached the lower support of the descending triangle, and now it would be interesting to watch whether the bulls could trigger a trend reversal. The trading conditions do not support a bullish narrative but the MACD is displaying the possibility of a trend reversal as the levels are closer to achieving a bullish crossover. However, until the levels rise within the bullish range, the XRP price may remain consolidated within the triangle.
Besides, the longer perspective flashes huge alarms as the price is testing one of the key support levels. The 200-day MA in the short term is acting as a key support level but in the longer time frame, it has been a strong support. After defending the support for a few days, the bulls appear to have fallen weak and as a result, there are higher chances of a breakdown in the lower support.
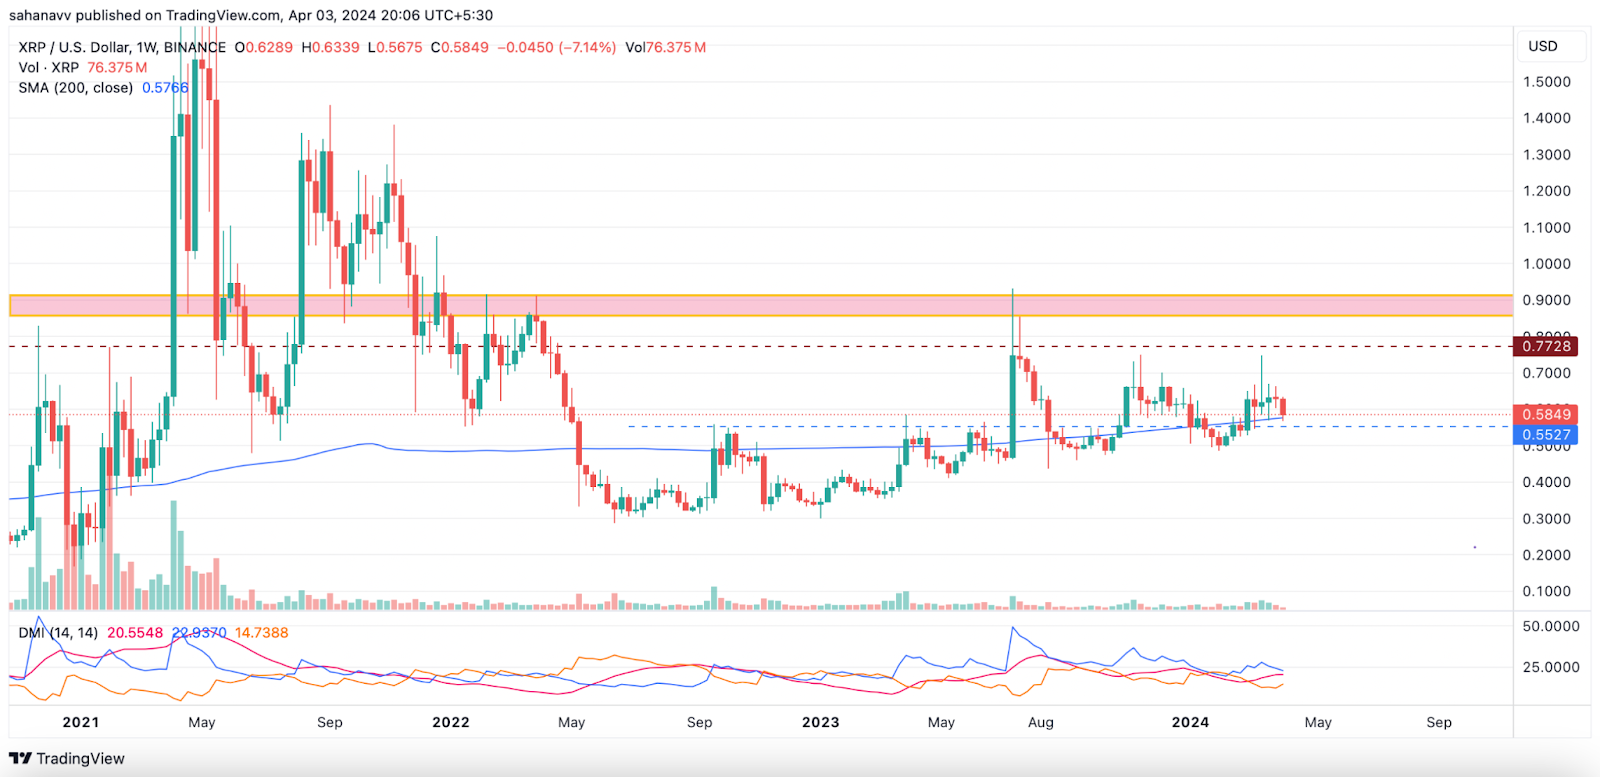
In the long term, the XRP price is testing the 200-day MA levels and here is why the trade appears to be bearish. The DMI is closer to flashing a bearish signal as the ADX is ranging within the lower range and both the +Di & -Di are approaching a bearish crossover. Therefore, a breakdown to $0.522 appears to be imminent and if the bulls fail to defend the support, a major correction may knock-in, which may drag the levels down, probably below $0.5.
However, the broader market conditions do not appear to favour such a bearish event and hence a minor correction may attract huge liquidity, which may uplift the XRP price above bearish captivity.
30d ago•
bullish:
0
bearish:
0
Share

 Manage all your crypto, NFT and DeFi from one place
Securely connect the portfolio you’re using to start.

bullish:
0
bearish:
0


bullish:
0
bearish:
0

bullish:
0
bearish:
0