Ripple (XRP) Price Attempts to Cross Above Resistance
2d ago•

bullish:
0
bearish:
0
Share

Ripple’s (XRP) price has steadily declined since it closed at a year-to-date high of $0.72 on March 11. The token’s price has fallen by 7% in the last month.
This recent decline has led to the formation of a descending triangle that the seventh-largest cryptocurrency by market capitalization now seeks to break out of.
Ripple Makes its Move Toward Resistance
At press time, XRP was at $0.48. It traded close to the upper line of its descending triangle, which has formed resistance since May 22.
A descending triangle is a bearish pattern formed when an asset’s price makes a series of lower highs while maintaining a relatively flat support level.
When an asset’s price attempts to cross above the upper trendline of this triangle, which forms a resistance level, it signifies a potential bullish breakout. If the breakout is accompanied by increased trading volume, it confirms a possible trend reversal from bearish to bullish.
XRP has seen a surge in daily trading volume in the past few days. In the past 24 hours, the altcoin’s trading volume has totaled $775 million, spiking by over 30%.
Read More: How To Buy XRP and Everything You Need To Know
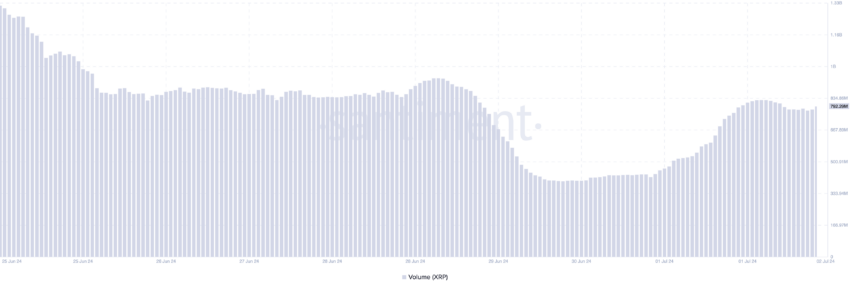 Ripple Trading Volume. Source: Santiment
Also, its weighted sentiment has flipped to positive for the first time since June 21. This metric tracks the overall mood of the market regarding an asset. It considers the sentiment trailing the asset and the volume of social media discussions.
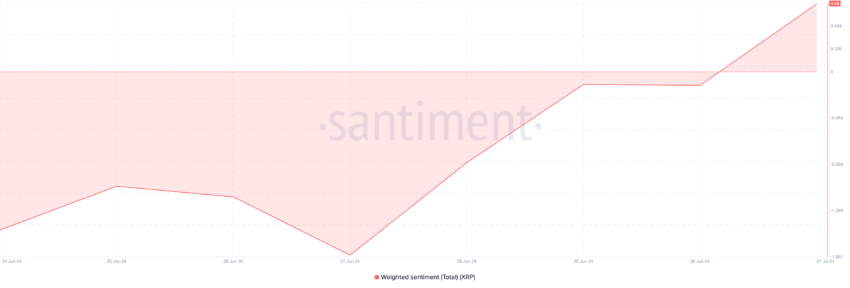 Ripple Weighted Sentiment. Source: Santiment
When it flips from negative to positive, it suggests a shift in market sentiment from bearish to bullish. At press time, XRP’s weighted sentiment is 0.68.
XRP Price Prediction: Buyers and Sellers Are in a Tussle
As XRP begins to rally, readings from its Moving average convergence/divergence (MACD) indicator reveal that a bullish crossover of the MACD line (blue) and the signal line (orange) occurred on June 30.
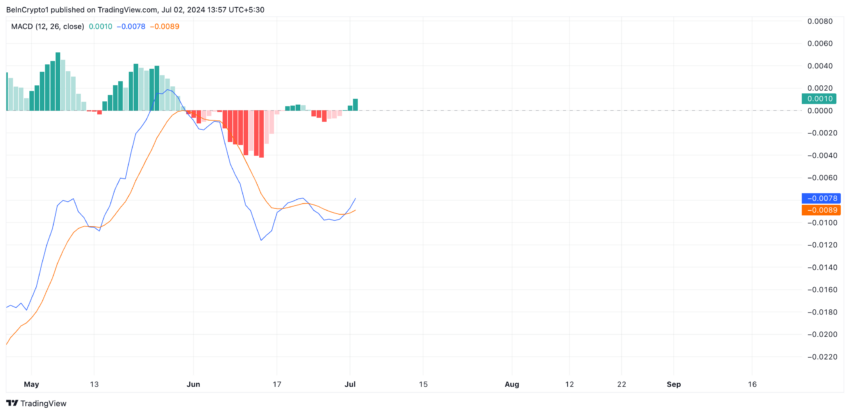 Ripple Analysis. Source: TradingView
This indicator measures an asset’s price trends and identifies potential buy or sell signals. When the MACD line intersects the signal line in an uptrend, it is bullish. Traders often interpret it as a buy signal, as the asset’s shorter-term average is rising faster than its longer-term average.
If XRP’s weighted sentiment remains positive and demand for the altcoin continues to climb, its price may rally to $0.49.
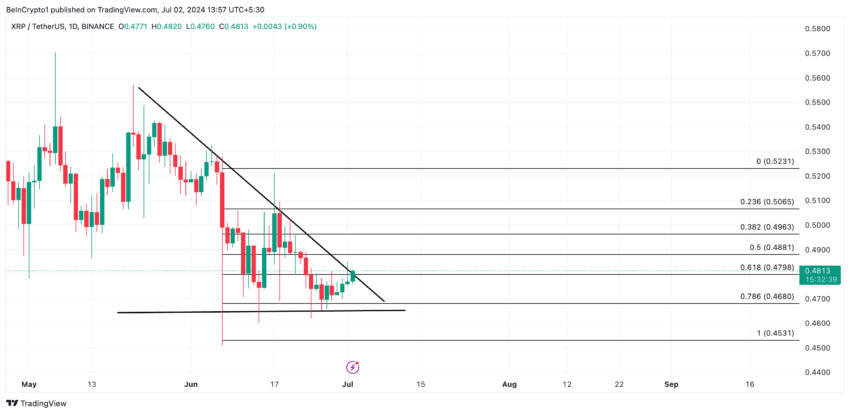 Ripple Analysis. Source: TradingView
However, if it fails to break above resistance and falls back within the triangle, the above projection is invalidated and will trade at $0.47.
2d ago•
bullish:
0
bearish:
0
Share


 Manage all your crypto, NFT and DeFi from one place
Securely connect the portfolio you’re using to start.

bullish:
0
bearish:
0


