Bullish Recovery of Solana: Impact of ETF Announcements – Crypto Analysis of July 3, 2024
2d ago•
bullish:
0
bearish:
0
Share
While the entire crypto market is in a phase of indecision, Solana rebounds for the third time on the support of $125. Let’s examine the upcoming prospects for SOL’s price.

Situation of Solana (SOL)
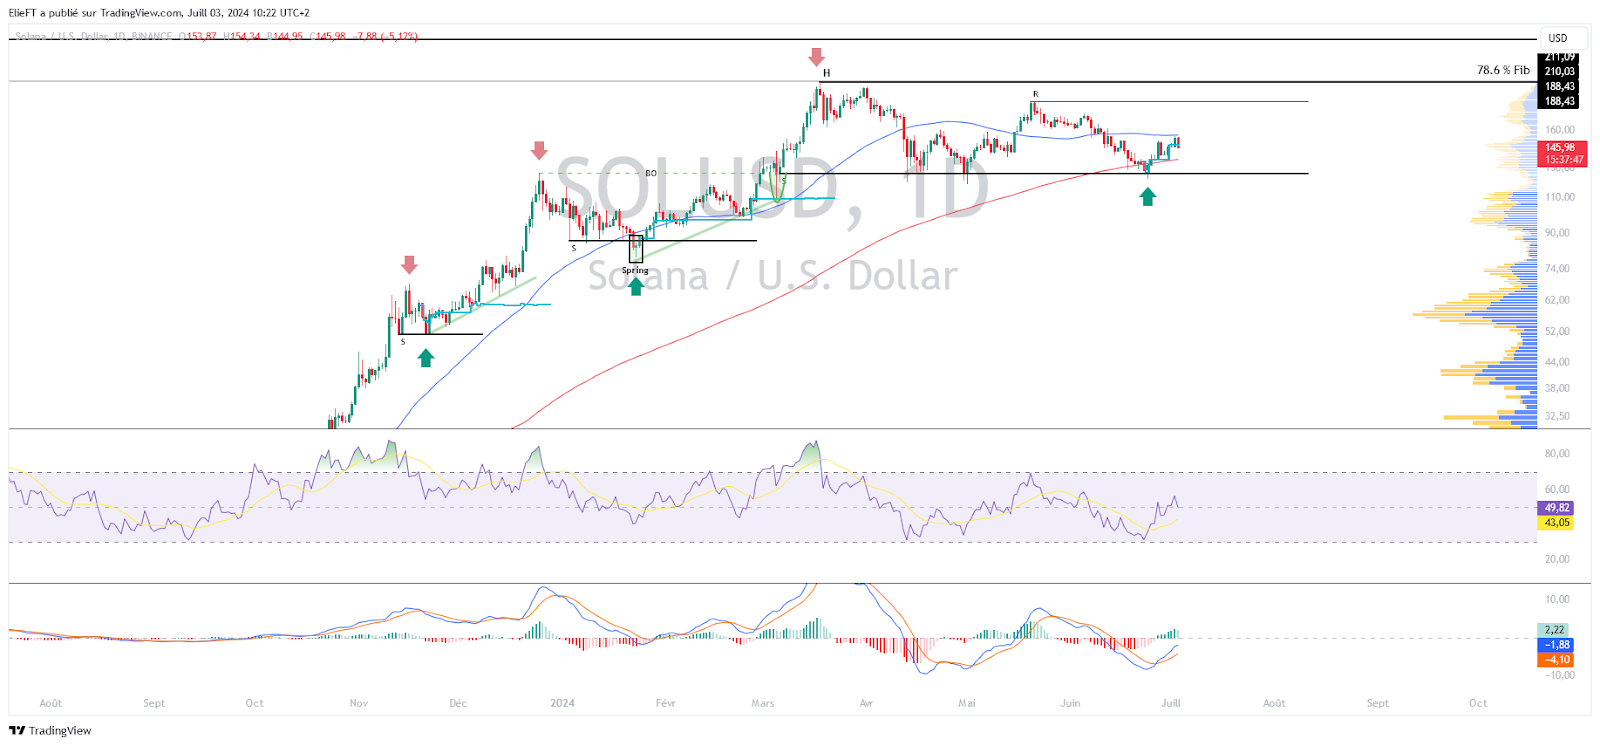
After reaching a peak at $211, Solana suffered a decline of more than 40%, gradually bringing its price back to around $120. This price level has acted as support for SOL, allowing it to benefit from a bullish momentum that unfortunately ended at $190. Thus, this latter price level makes it a notable resistance. Recently, Solana’s price has bounced once again around $125. To the great delight of latecomers, the Canadian institution 3iQ and the American institutions Vaneck and 21Share have officially filed their applications to issue a spot Solana ETF. Naturally, optimism about the cryptocurrency is felt. Some people do not hesitate to imagine a price of Solana multiplied by 9 if these ETF applications are approved.
Nevertheless, the market’s reaction to this news has not impacted the cryptocurrency as much as Bitcoin during the same phenomenon. Indeed, the crypto still seems heavy. This can partly be explained by a decline in Bitcoin affecting the entire market. As of the time of this writing, the price of Solana is trading around $145. The medium and long-term trend of Solana remains bullish. However, the fact that it is below its 50-day moving average raises doubts about the continuation of this trend. Fortunately, we can be reassured with the 200-day moving average, which still positions itself below the crypto price and remains upward-oriented. Note, these MAs are getting closer, suggesting upcoming volatility to be considered. On the price dynamics side, we can naturally observe that it has resumed, as evidenced by Solana’s own price as well as the oscillators. All these elements show genuine buyer interest, suggesting that Solana crypto is about to form a trough, a chart pattern indicating a bullish continuation.
The current technical analysis was conducted in collaboration with Elie FT, an investor and passionate trader in the cryptocurrency market. Today a trainer at Family Trading, a community of thousands of proprietary traders active since 2017. There you will find Lives, educational content, and mutual aid around the financial markets in a professional and friendly atmosphere.
Focus on Solana (SOLUSDT) derivatives
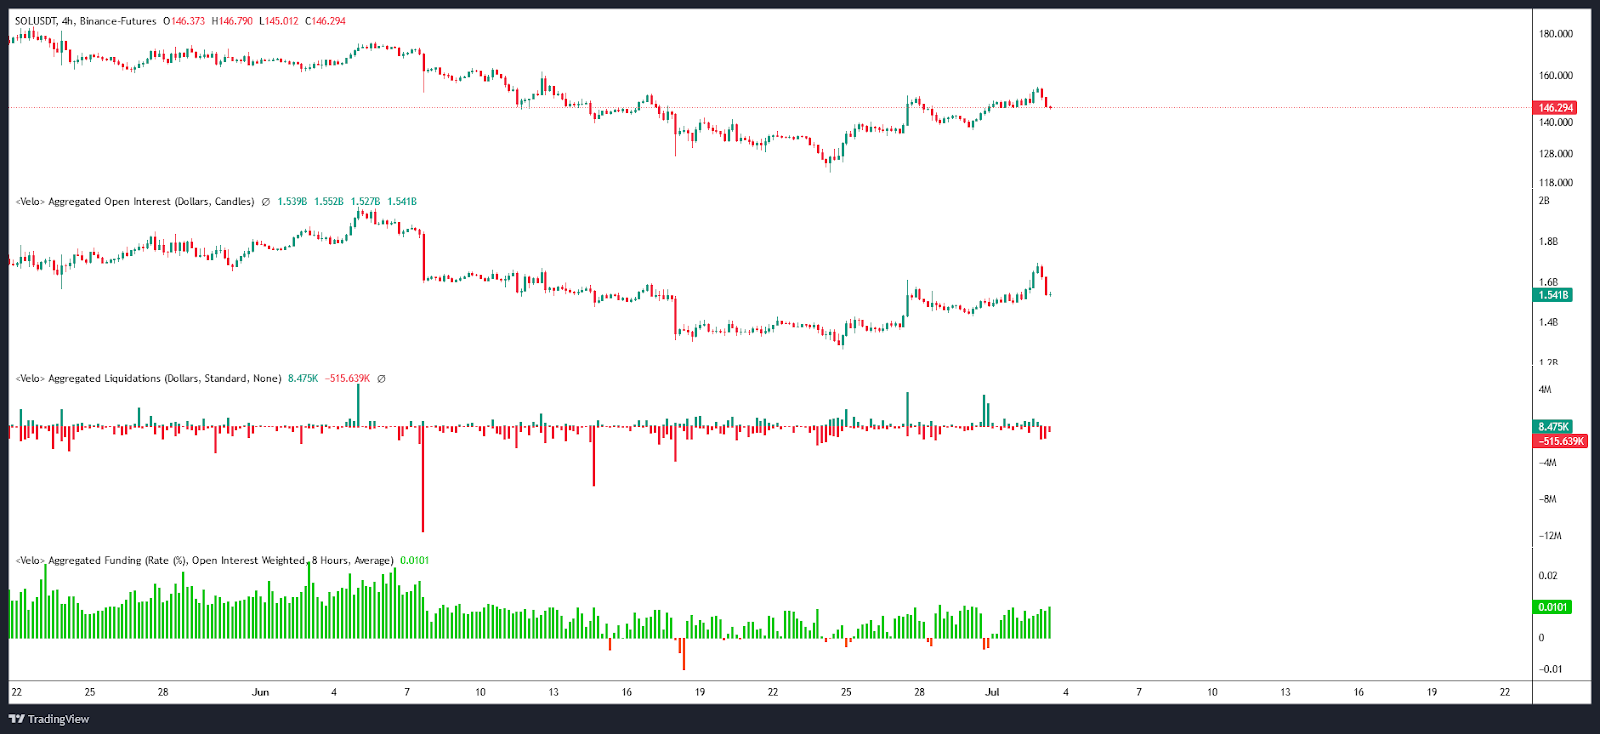
The open interest of SOL/USDT contracts has evolved similarly to the cryptocurrency. This suggests that speculators have primarily taken long positions. This hypothesis is supported by positive and slightly increasing funding rates, illustrating traders’ participation mostly oriented towards buying. On the liquidation side, they remain low and do not send concrete signals. However, it can be noted that the most significant liquidations occurred during the last bullish impulses, suggesting a capitulation of sellers on the crypto.
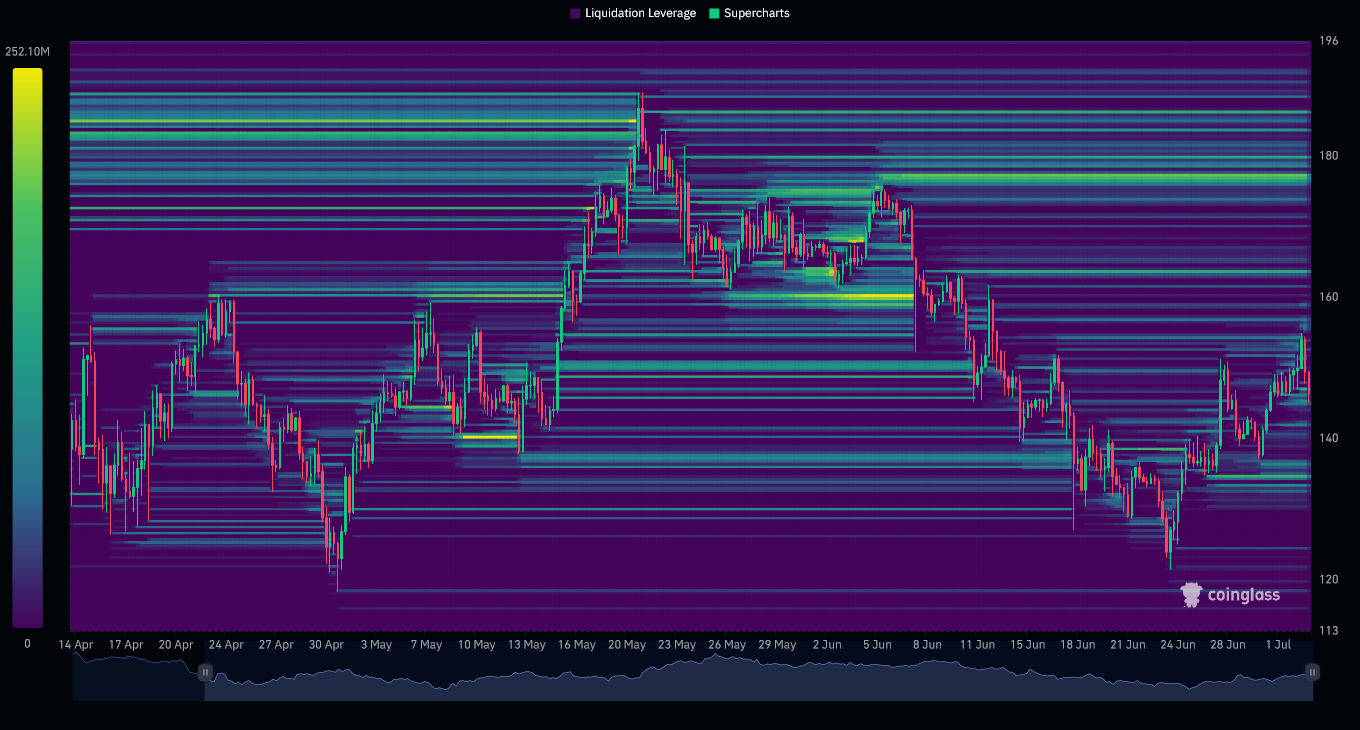
The heatmap of SOL/USDT liquidations over three months shows that the crypto has crossed the liquidation zone located around $137. This did not directly attract buying interest. Indeed, Solana first plunged below $125 to reposition itself above $135 and continue its upward trend. Incidentally, it is below this latter price level where an apparent liquidation zone appeared. However, the most significant one is found above the current SOL price, precisely below $180. The price approaching these levels could trigger a massive set of orders, increasing the risk of a period of heightened volatility for Solana. These zones, therefore, represent a crucial point of interest for investors.
Hypotheses for Solana (SOL) price
- If Solana’s price stays above $125, a bullish continuation towards the $170 level, or even $190, could be anticipated. The next resistance to consider, if the bullish movement continues, could be $210, and beyond, Solana’s all-time high at $265. At this point, it would represent an increase of over 83%.
- If Solana’s price fails to stay above $125, a return to the $110 levels could be envisaged. The next support to consider, if the bearish movement continues, would be around $100, or even $90. Lower still, the support at $86 can be noted. At this point, it would represent a decline of below 40%.
Conclusion
Solana has enjoyed a recovery at its support level established since April. The ETF requests by several institutions have sparked notable optimism in the market, even if the impact was not as strong as expected. Despite some short-term uncertainties, the general trend remains positive, driven by favorable price dynamics and growing buyer interest. That said, it will be crucial to closely observe the price’s reaction to the different key levels to confirm or refute the current hypotheses. It is also important to stay vigilant against potential “fake outs” and market “squeezes” in each scenario. Finally, let’s remember that these analyses are based solely on technical criteria and that the price of cryptocurrencies can also quickly evolve based on other more fundamental factors.
2d ago•
bullish:
0
bearish:
0
Share


 Manage all your crypto, NFT and DeFi from one place
Securely connect the portfolio you’re using to start.

bullish:
0
bearish:
0


bullish:
0
bearish:
0
