
Dogecoin ETF Inflows Begin! Can $DOGE Explode 10X From Here?

0
0

Dogecoin just crossed a milestone. Spot $DOGE ETFs came alive with fresh capital for the first time, pulling in $285K in net inflows on day one.
It's a small number next to DOGE's massive supply, but it's the first real institutional door opening for the meme coin.
This Dogecoin price prediction breaks down what the ETF inflows mean and whether the chart is ready to follow.
Dogecoin Liquidation & Volume Today
Liquidation Data From Coinglass
| Timeframe | Total Rekt | Long | Short |
| 12h | $950.83K | $462.69K | $488.14K |
| 24h | $2.27M | $1.68M | $595.10K |
Long liquidations picked up sharply over the 24h window compared to shorts, pointing to leveraged longs getting flushed out during the recent pullback.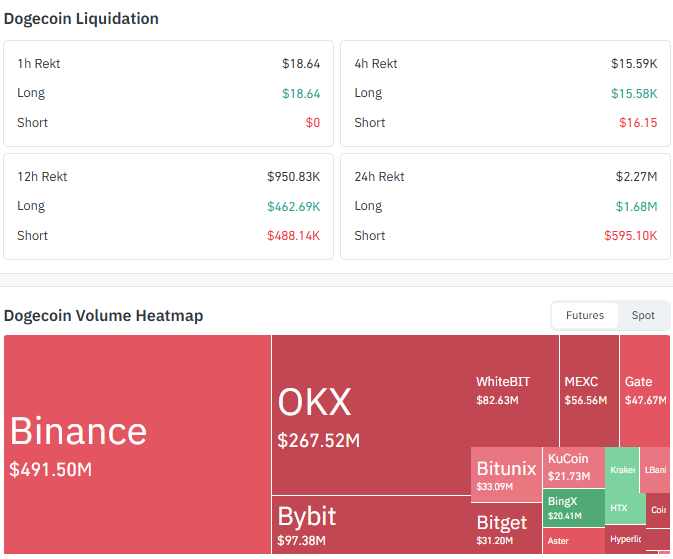
Futures Volume by Exchange (Coinglass)
Binance leads $DOGE futures volume at $491.50M, followed by OKX at $267.52M and Bybit at $97.38M.
WhiteBIT ($82.63M), MEXC ($56.56M), Gate ($47.67M), Bitunix ($33.09M), Bitget ($31.20M), KuCoin ($21.73M), and BingX ($20.41M) round out the next tier.
Dogecoin News Today: Spot $DOGE ETF Sees First Inflows
In today's crypto news, a report said spot ETF products for $DOGE and HBAR came alive with net inflows of +$285K and +$103K respectively on their first day.
The report added that the three Dogecoin ETFs together hold only 0.09% of $DOGE's total supply so far, while a separate $HBAR ETF already holds 1.72% of that token's supply.
Source: Data From X
$DOGE Technical Analysis: Price Chart and EMA Levels
DOGE is trading at $0.080806, holding above a support band of $0.075059 and $0.078291 near the bottom of a descending channel.
The DOGE EMA levels sit just above price, with the EMA 20 at $0.081594 and the EMA 50 at $0.083378 both acting as resistance for now.
Let's see if this pattern repeats and whether DOGE starts moving higher. Watch the chart and key levels below for more details.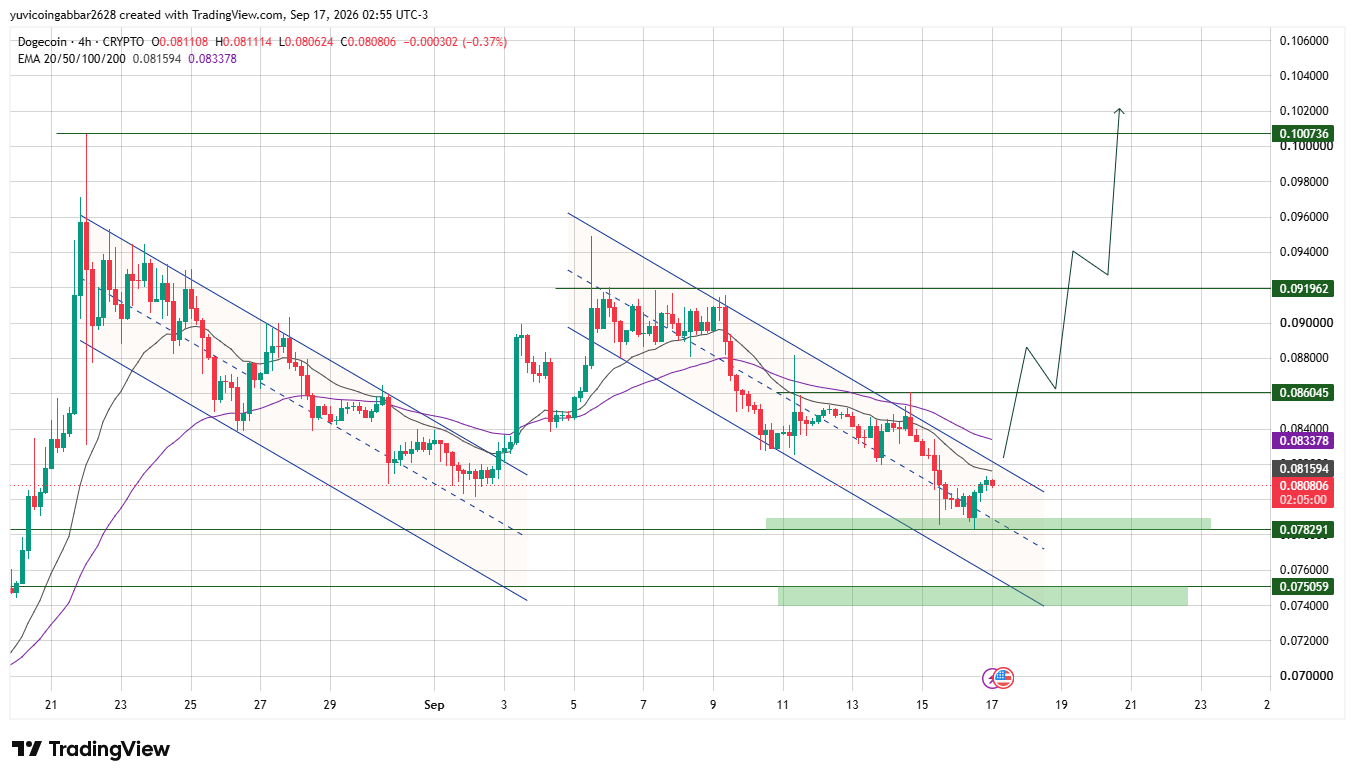
DOGE Support and Resistance Levels: Dogecoin Outlook
| Level Type | Price |
| Resistance 3 | $0.100736 |
| Resistance 2 | $0.091962 |
| Resistance 1 (nearest) | $0.086045 |
| Immediate Price Reference | $0.080806 |
| EMA 20 (near resistance) | $0.081594 |
| EMA 50 (near resistance) | $0.083378 |
| Support Zone | $0.078291 |
| Deeper Support | $0.075059 |
Dogecoin Forecast: Bull Case vs Bear Case
Bull case: Holding the $0.078291 support zone and reclaiming the EMA cluster at $0.081594 to $0.083378 would open the path toward $0.086045, then $0.091962 if ETF-driven demand keeps building.
Bear case: Losing the $0.078291 zone would risk a slide toward $0.075059, and a break below that would put the wider channel structure at risk of further downside.
Dogecoin Price Prediction: Triggers & Invalidation
| Scenario | Trigger | Likely Outcome | Invalidation Point |
| EMA reclaim | Clears $0.081594–$0.083378 | Push toward $0.086045 | Rejection at EMA cluster |
| Support hold | Holds above $0.078291 | Range-bound before next attempt | Close below $0.078291 |
| Breakdown | Loses $0.078291 | Deeper pullback toward $0.075059 | Support zone lost |
Dogecoin Crypto Prediction: Can $DOGE Reach $0.100736?
$0.100736 is the highest resistance level marked on the chart.
Reaching it would require $DOGE to first reclaim the EMA cluster near $0.081594 to $0.083378, then clear $0.086045 and $0.091962 in sequence, a multi-stage recovery rather than a single move.
Dogecoin Coin Price Prediction: Can DOGE 10X From Here?
A 10x from the current price of $0.080806 would put DOGE near $0.81, a level nowhere close to anything on today's chart.
The highest resistance marked here is $0.100736, itself only about 25% above the current price, so a 10x move would need DOGE to clear that level and then run roughly 8 times further.
That kind of move has happened before in DOGE's history during broader crypto bull cycles, but nothing in the current chart structure points to it happening in the near term.
This could be a practical long-term scenario if the altcoin bull cycle repeats. However, the outcome would depend on market conditions, adoption, and sustained buying pressure.
Dogecoin Price Prediction 2026: Expert View
According to CoinGabbar analysts , The ETF inflows are modest in dollar terms but mark a real first step for institutional access to DOGE.
The chart still shows price sitting inside a support band at the bottom of a descending channel, so the EMA cluster near $0.0816 to $0.0834 is the level that decides whether this turns into a genuine reversal.
Disclaimer
This piece is for informational purposes only and isn't financial advice. The levels and scenarios above are based on technical chart analysis and publicly available data at the time of writing, and crypto markets can move sharply within hours, so past patterns don't guarantee future outcomes. It's worth doing independent research and considering your own risk tolerance before acting on any of the levels discussed here.
0
0

 Manage all your crypto, NFT and DeFi from one place
Securely connect the portfolio you’re using to start.


