
Chainlink Price Prediction: One Breakout Could Change $LINK Forever

0
0

LINK is back on trader radars this week, and this Chainlink price prediction is exactly why.
Chainlink has been one of the more established names in crypto since it launched back in 2017, and LINK price action still tends to move in step with the broader market.
The token slipped about 1% over the past day after a recent push higher stalled out. LINK is trading at $8.62 right now.
This Chainlink price prediction walks through the latest chart setup, live liquidation data, and the exact levels that could send LINK higher or lower from here.
Chainlink is a decentralized oracle network that connects smart contracts to real-world data and off-chain systems, according to the project's own materials.
Stick around, because the next few candles on this chart could decide which way LINK trades next.
Chainlink Price Prediction: Market Overview
| Metric | Value |
|---|---|
| Price | $8.62 |
| 24H Change | -1.0% |
| Market Cap | $6.45B |
| Fully Diluted Valuation | $8.62B |
| 24H Trading Volume | $186.80M |
| Total Value Locked (TVL) | $1.59B |
| Circulating Supply | 748.1M LINK |
| Max Supply | 1,000,000,000 LINK |
Source: CoinGecko Chainlink market data, data as of July 22, 2026. Figures may vary slightly across other tracking websites.
Chainlink Liquidation Data
Futures activity has picked up around the channel test.
CoinGlass 22/07/2026 data shows Chainlink liquidations of $4.84K over the past hour, $7.33K over 4 hours, $20.33K over 12 hours, and $97.42K over 24 hours.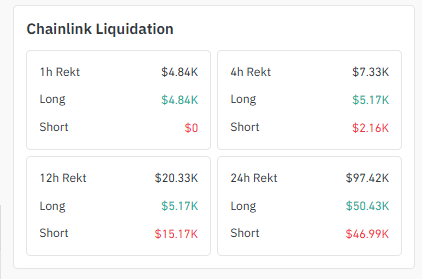 Source: According to Coinglass Liquidation Data
Longs made up roughly $50.43K of that 24-hour figure against $46.99K in shorts, which tells us traders are positioned on both sides heading into this breakout test rather than crowding into one direction.
The 1-hour window was entirely long-side liquidations at $4.84K, while the 12-hour window flipped toward shorts at $15.17K, suggesting positioning has been swinging back and forth rather than settling in one direction.
Chainlink Exchange Volume Heatmap
On the spot and futures side, Binance is carrying the bulk of Chainlink volume at $67.15M over the past 24 hours, more than double the next closest venue. 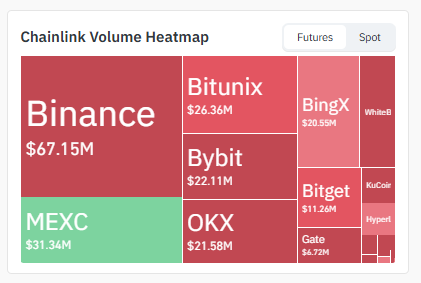
Source: According to Coinglass Volume Heatmap Data
MEXC follows at $31.34M, then Bitunix at $26.36M, Bybit at $22.11M, and OKX at $21.58M. Smaller pockets of volume are spread across BingX at $20.55M, Bitget at $11.26M, and Gate at $6.72M, with KuCoin, WhiteBIT, and Hyperliquid rounding out the rest.
This heavy concentration on Binance means price action there tends to lead the rest of the market, and it is the venue worth watching first for any breakout or breakdown confirmation.
Chainlink Holder Data
Chainlink currently has 900,967 holders on-chain, up slightly over the past day. Ownership is still concentrated at the top:
The top 100 wallets control 60.91% of the supply; whale-tier wallets make up just 0.34% of holders yet hold 89.63% of the market cap, and 13 wallets each own at least 1% of the total supply. 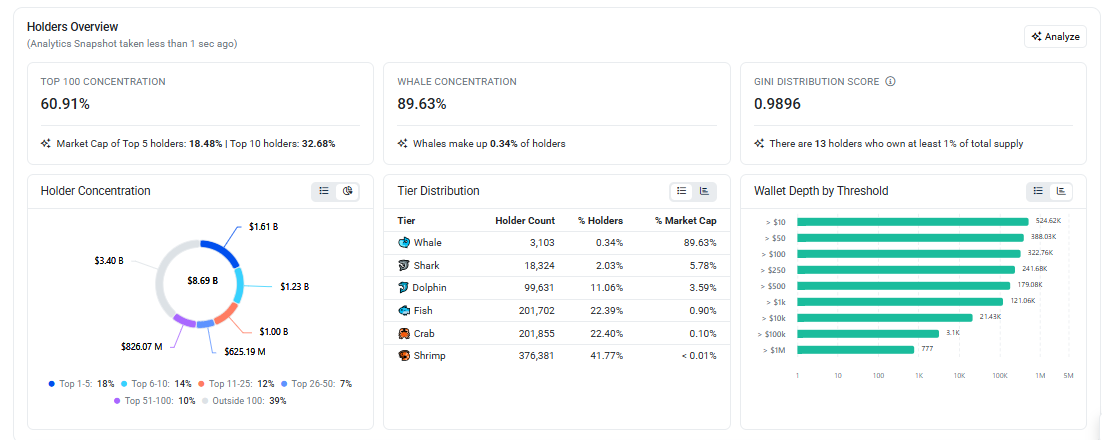
Source: Holder Data Taken From Etherscan.
Further down the chain, shark wallets hold 5.78% of market cap, dolphin wallets hold 3.59%, and the long tail of fish, crab, and shrimp wallets, which together make up over 86% of all holders, controls barely 1% of supply combined.
That concentration is not new information for LINK, but it is worth knowing before reading too much into any single wallet's activity.
Separately, a market tracking account on X cited Santiment data showing a 12% drop in Chainlink's exchange supply over the past month, with liquid exchange inventory near multi-month lows. 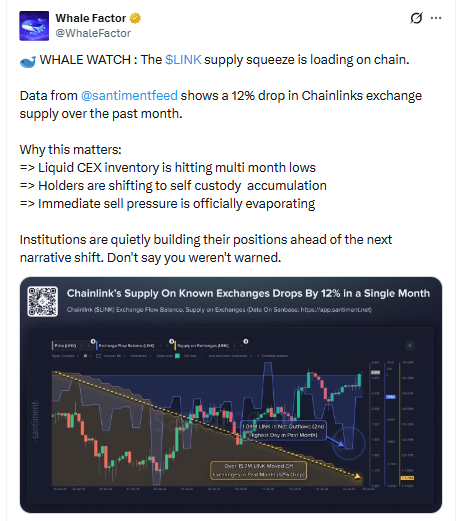
Source: Data Taken From @whalefactor x Account.
That kind of move is generally read as a sign that coins are shifting into self-custody rather than sitting ready to sell, though it does not guarantee price direction on its own.
Chainlink Chart Analysis
Chart levels below were read directly off the 4-hour and daily TradingView charts for the LINK/USDT pair on Binance, using the visible channel boundaries, swing highs, and swing lows rather than any indicator overlay.
4-Hour Chart: Ascending Channel
The 4-hour chart shows LINK climbing inside a well-defined ascending channel since the recent low, with both the upper and lower boundaries rising in parallel.
Price is currently pressing against the upper boundary of that channel near $8.70 to $8.80, the same zone where it has been rejected on recent tests. 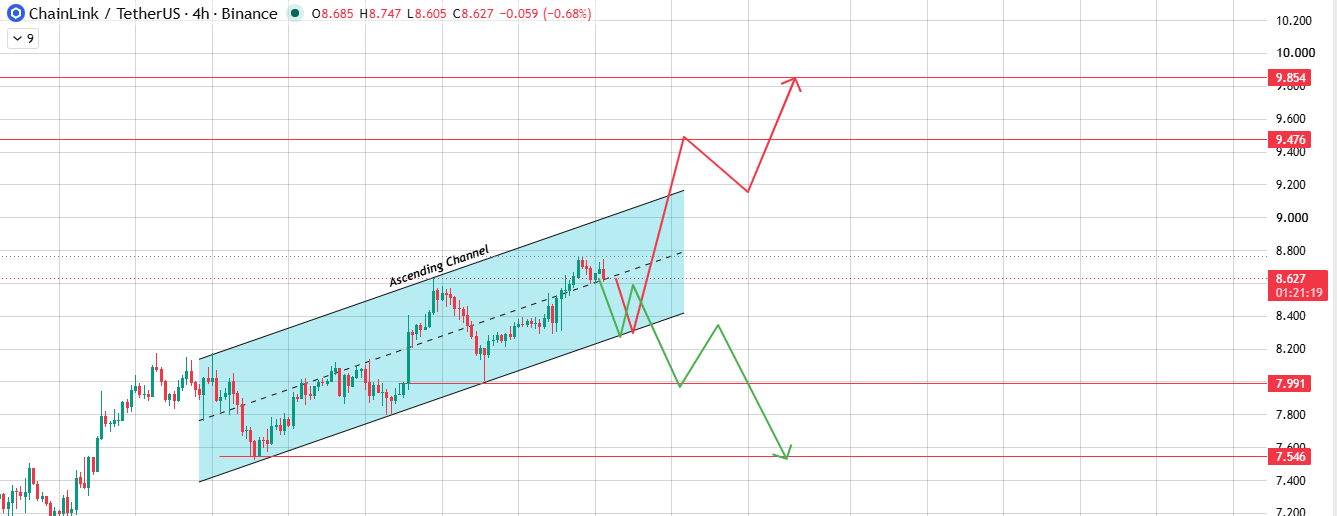
Source: Chart Taken From TradingView
If LINK closes above the upper boundary of this channel with follow-through volume, the setup points toward $9.48 first, with a further extension toward $9.85 if buyers stay in control.
If instead LINK breaks below the lower boundary of the channel, that would mark a loss of the current uptrend structure, and the setup points toward a pullback to $7.99 first, with the risk of a deeper move to $7.55 if that level fails to hold.
Daily Chart: Double Bottom Retest
The daily chart tells a different but related story. LINK carved out a W-shaped double bottom with a low near $6.98, then rallied back up through the $8.23 support and retest zone where the price is trading now.
This pattern is typically read as a base-building structure rather than a confirmed reversal until the neckline resistance is cleared. 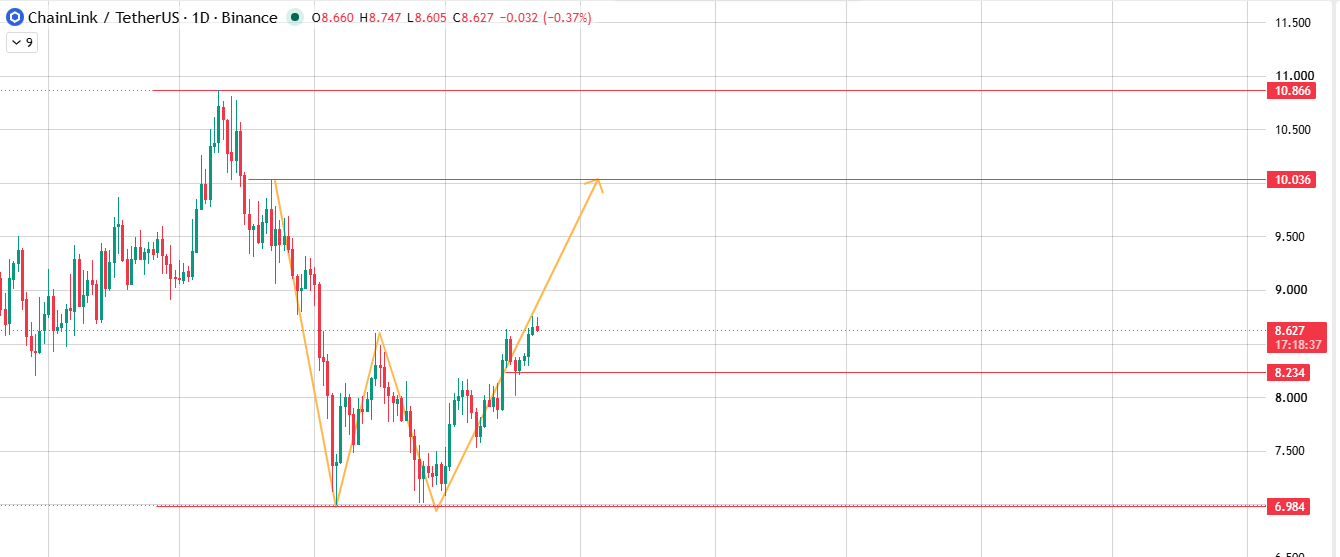
Source: Chart Taken From TradingView
If buyers defend the current $8.23 to $8.63 zone and push through the recent local high, the daily structure opens the door to $10.04 and then $10.87 over the following weeks.
If this support zone fails and the price closes back below $8.23, the daily setup would put the $6.98 double bottom low back in play as the next real test of buyer conviction.
Key Levels to Watch
| Level Type | Price |
|---|---|
| Daily Resistance 2 | $10.866 |
| Daily Resistance 1 | $10.036 |
| 4H Upside Target 2 | $9.854 |
| 4H Upside Target 1 | $9.476 |
| Current Price | $8.627 |
| Daily Support Retest Zone | $8.234 |
| 4H Downside Target 1 | $7.991 |
| 4H Downside Target 2 | $7.546 |
| Daily Double Bottom Low | $6.984 |
Key Takeaways
-
LINK is trading at $8.62, down close to 1% over the past 24 hours, and sits inside a rising channel on the 4-hour chart.
-
A double bottom has formed on the daily chart with a low near $6.98, and the price is now retesting the $8.23 to $8.63 zone.
-
24-hour liquidations across Chainlink futures reached $97.42K, split almost evenly between long and short positions.
-
The exchange supply of LINK has dropped 12% over the past month, according to Santiment data shared by a market-tracking account on X.
A confirmed breakout above channel resistance opens a path toward $9.48 and $9.85, while a breakdown risks a slide toward $7.99 and $7.55.
Two Scenarios to Watch
Breakout Scenario
If LINK clears the upper boundary of the 4-hour ascending channel and holds above $8.80 on a closing basis, the first target sits at $9.48, roughly 10 % above the current price.
A continuation from there brings $9.85 into view, close to 14 % above current levels.
This scenario lines up with the daily double bottom structure, since a 4-hour breakout would also put LINK on track to challenge the $10.04 daily resistance level next.
Breakdown Scenario
If LINK instead breaks the lower boundary of the ascending channel and loses the $8.23 daily support and retest zone, the first downside target is $7.99, close to 7% below the current price, with a deeper move to $7.55 representing roughly a 12 % drawdown.
A failure to hold that zone would put the chainlink double bottom pattern itself at risk, since a clean break back below $8.23 would mean the price is heading toward retesting the $6.98 low rather than building on top of it.
Risk Note
Chainlink remains a volatile asset, and both the channel breakout and double bottom setups described here are technical patterns, not guarantees of future price movement.
The near-even split between long and short liquidations over the past 24 hours suggests the market has not fully committed to either direction yet, and a sharp move in either direction could trigger a fast round of liquidations given current open positions.
Ownership also remains concentrated, with whale wallets controlling close to 90 % of market cap, which means large wallet activity can move price faster than order book depth might suggest.
Traders should treat every level above as a point to watch rather than a certainty and should account for their own risk tolerance before acting on any of these setups.
Chainlink Price Prediction: Expert View
Taken together, the 4-hour channel and the daily double bottom are pointing in the same direction for now, with LINK sitting at a genuine decision point rather than mid-trend.
The base case leans toward continuation given the channel structure and the drop in exchange supply noted by on-chain trackers, but the setup is not confirmed until the price actually closes above the channel's upper boundary and the recent local high.
Readers who want a broader view of how LINK is positioned against the rest of the market can check this Chainlink market outlook alongside the levels above before making any decision.
Disclaimer: This article is for informational purposes only and does not constitute financial advice. Cryptocurrency markets are highly volatile, and prices can move sharply in either direction. Always do your own research and consult a licensed financial advisor before making investment decisions.
0
0

 Manage all your crypto, NFT and DeFi from one place
Securely connect the portfolio you’re using to start.

0
0

0
0

0
0

0
0