Arbitrum (ARB) Shows Buy Signal: Why Timing Might Be Off
14d ago•

bullish:
0
bearish:
0
Share

Arbitrum’s (ARB) on-chain metrics have flashed a buy signal amid general market consolidation.
However, an assessment of the Layer 2 (L2) token’s performance on a three-day chart hinted at the possibility of a further decline in its value in the short term.
Arbitrum Traders Wonder If the Time Is Right
At press time, ARB’s Market Value to Realized Value (MVRV) ratio, assessed using different moving averages (30-day and 365-day), returned negative values. The token’s MVRV ratios on 30-day and 365-day moving averages were -3.51% and -31.72%, respectively.
An asset’s MVRV ratio tracks the ratio between the asset’s current market price and the average price of its coin or token circulation.
When its value is positive, the asset is overvalued. This means that the asset’s current value is higher than the price at which most investors acquire their holdings. On the other hand, a negative MVRV ratio suggests that the asset in question is undervalued, as its market value is below the average purchase price of all its tokens in circulation.
A negative MVRV ratio presents a good time to buy because it signals to traders that the asset trades at a price lower than its historical cost basis. Hence, if they buy at that point, they will see returns.
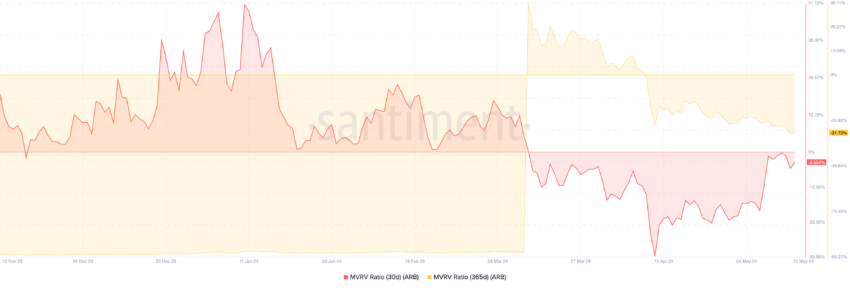 Arbitrum MVRV Ratio Source: Santiment
Further, a negative sentiment has been trailing ARB since April. At press time, the token’s weighted sentiment was -0.99.
Read More: Optimism vs. Arbitrum: Ethereum Layer-2 Rollups Compared
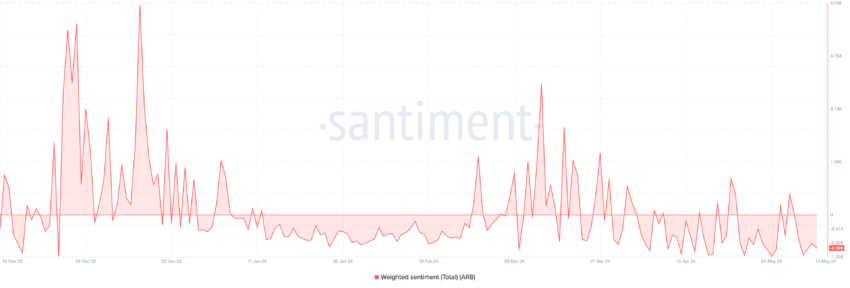 Arbitrum Weighted Sentiment Source: Santiment
Historically, this has been known to present a good buying opportunity. When an asset’s sentiment grows poor, and the market expects further decline, crypto assets often initiate uptrends as sellers become increasingly exhausted.
ARB Price Prediction: Short-term Losses Are Ahead
While the metrics highlighted above hinted at the possibility of a rally, some indicators showed that the market may witness a further downtrend in the short term.
At the time of writing, ARB’s Relative Strength Index (RSI) was 29.79, sitting below the neutral line. This signaled that traders preferred to sell their ARB rather than hold them or accumulate more tokens.
The RSI measures the momentum of an asset’s price change. It ranges from 0 to 100, with values above 70 suggesting overbought conditions and below 30 signaling oversold conditions.
Further, ARB’s Chaikin Money Flow (CMF), which measures the flow of capital into and out of the asset, was -0.10 at press time. This negative value suggested increased liquidity exit from the token’s market, which may put downward pressure on its price.
If bearish pressure mounts, ARB’s price may fall below the long-term support of $0.92 at which it currently trades. Its value may drop under $0.90 to trade at $0.84.
Read More: Arbitrum (ARB) Price Prediction 2024/2025/2035
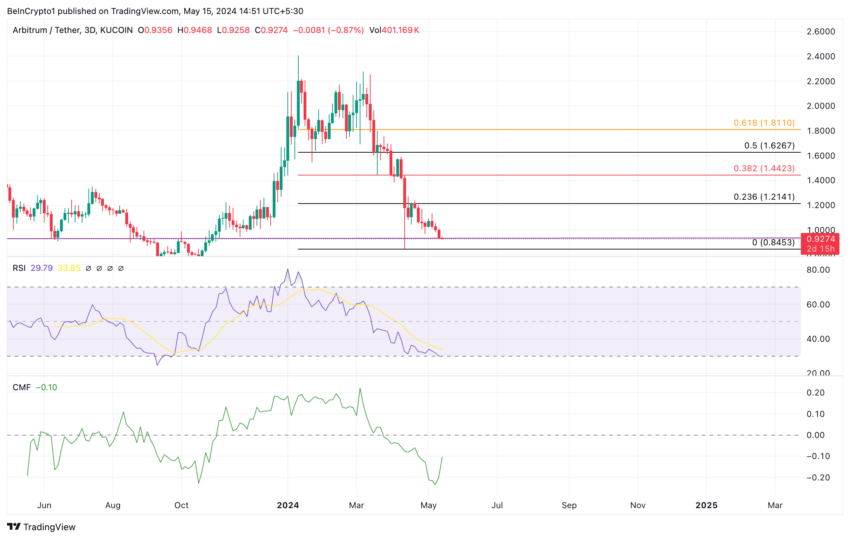 Arbitrum Price Analysis. Source: Tradingview
However, if this projection is invalidated and the bulls regain market control, the L2 token’s price might rally above $1 to exchange hands at $1.2.
14d ago•
bullish:
0
bearish:
0
Share


 Manage all your crypto, NFT and DeFi from one place
Securely connect the portfolio you’re using to start.

bullish:
1
bearish:
0


bullish:
0
bearish:
0
