Daily Market Review: BTC, ETH, AKT, TON, INJ
24d ago•

bullish:
0
bearish:
0
Share

Today’s market session has been dominated by bears as seen in today’s session. The total global market cap stood at $2,27T, representing a 0.68% drop over the last 24 hour. The trading volume on the other side, stood at $63.74B, representing a 0.63% increase over the last 24 hours.
Bitcoin Price Review
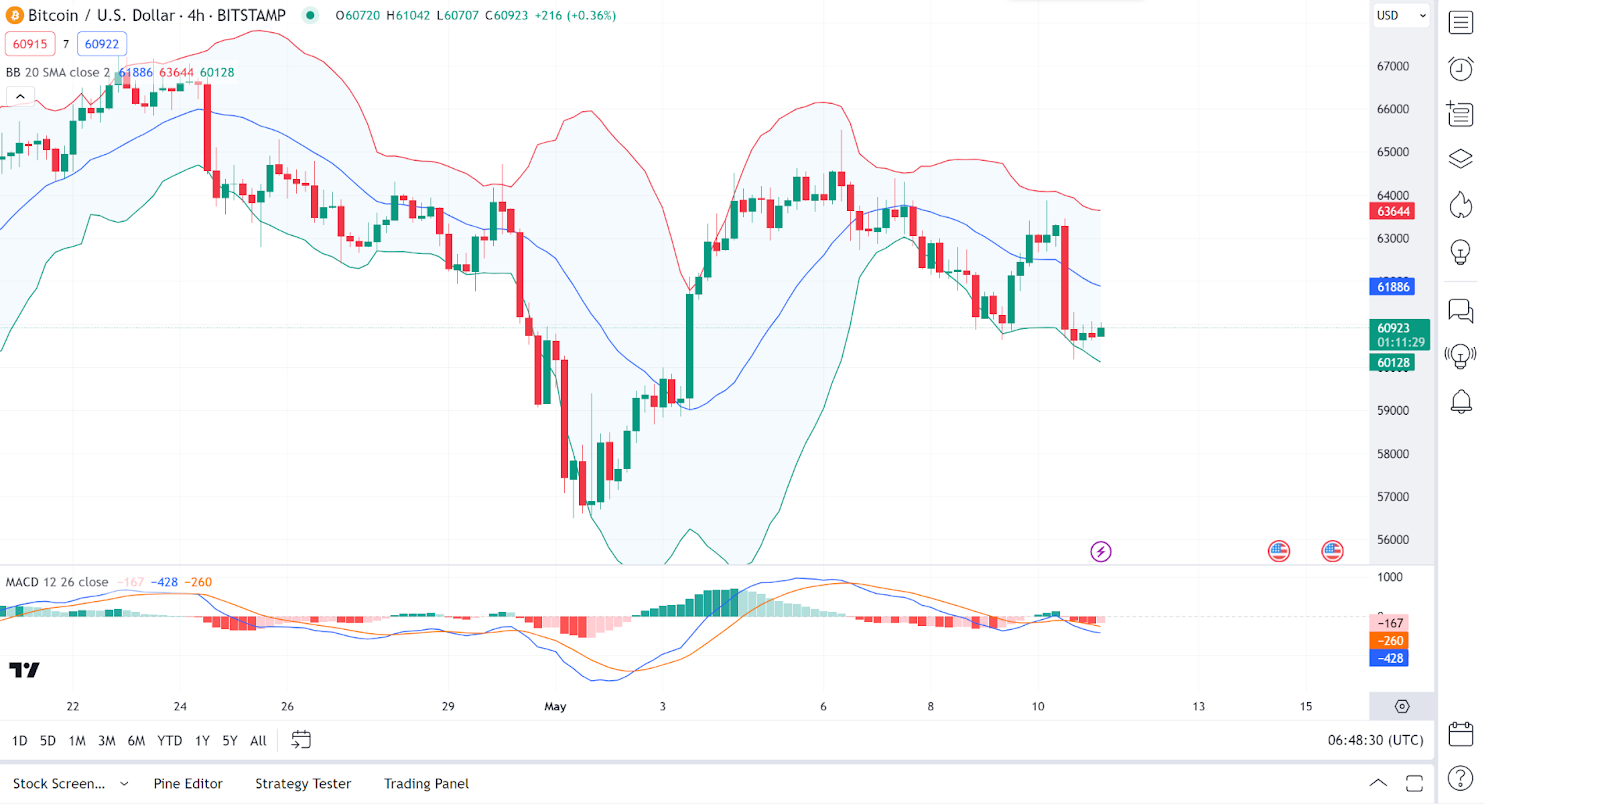
Bitcoin (BTC) is having a bear session today as it falls back below $61K. Looking at an in-depth analysis, we see that Bitcoin price charts shows a bearish trend with the price trading below the 20-period simple moving average (SMA) on the Bollinger Bands (BB). The Bollinger Bands are wide, suggesting high volatility.
On the other hand, the MACD indicator is below zero and showing a bearish crossover, which supports the downtrend. The recent price action is bearish with a slight recovery attempt that failed to breach the upper Bollinger Band, indicating potential further downside. As of press time, the Bitcoin price stood at $60,951, representing a 3.6% decrease from its previous 24-hour price.
Ethereum Price Review
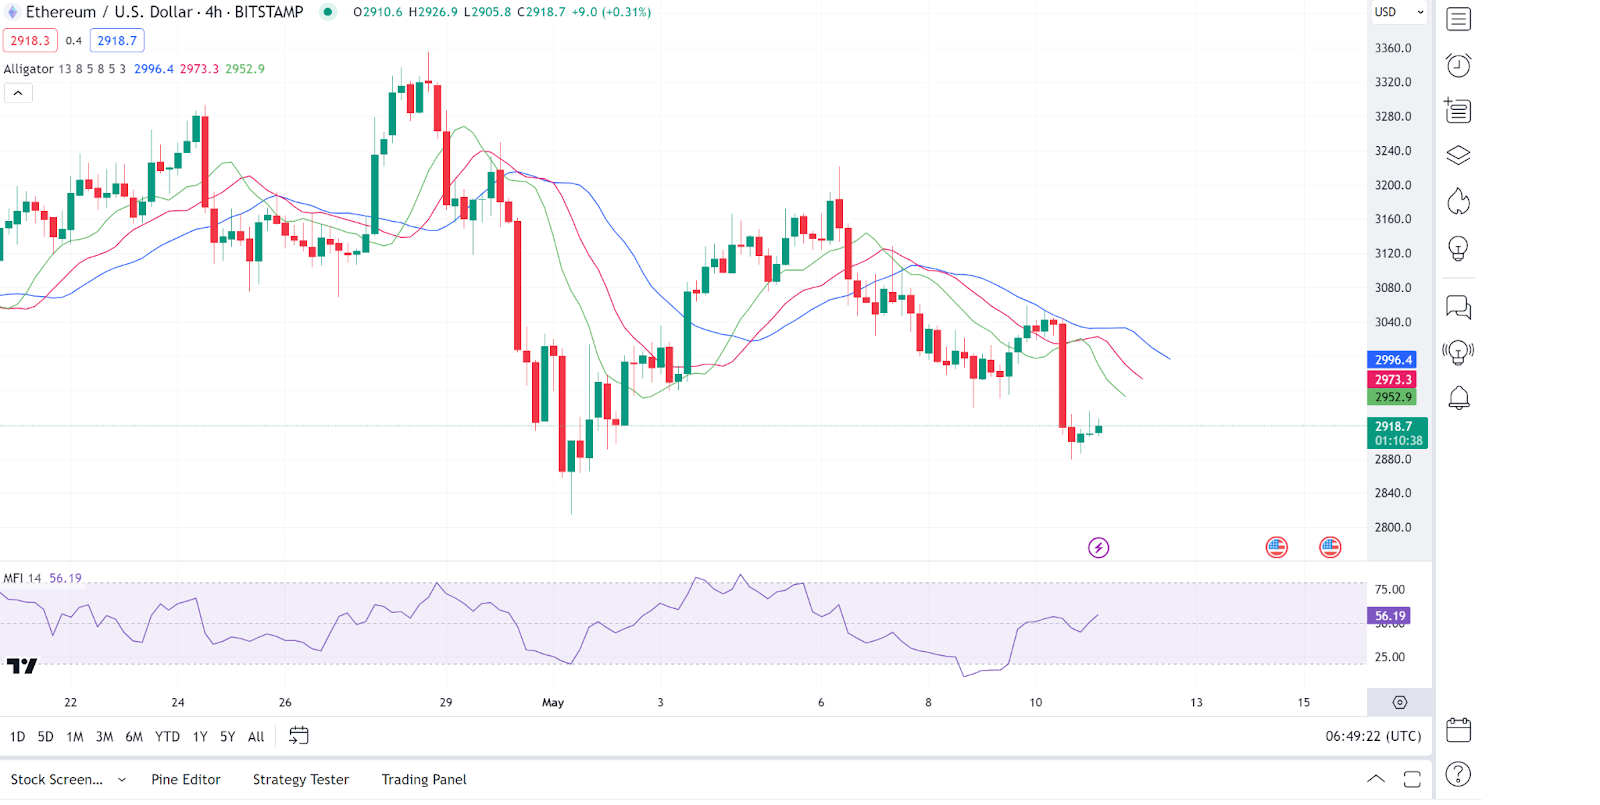
Ethereum (ETH) is also having a downtrend today as evidenced by its price movements. Looking at an in-depth analysis, we see that Ethereum’s chart displays a similar bearish trend, with prices consistently trading below the major moving averages, indicating strong selling pressure. The Alligator indicator shows the jaw, teeth, and lips are aligned downwards, confirming the downtrend.
On the other hand, the Money Flow Index (MFI) is hovering near the 50 level, suggesting a balance between buying and selling pressure, but the overall trend remains downward. As of press time, the Ethereum price stood at $2,920, representing a 4.3% decrease from its previous 24-hour price.
Akash Netwrok Price Review
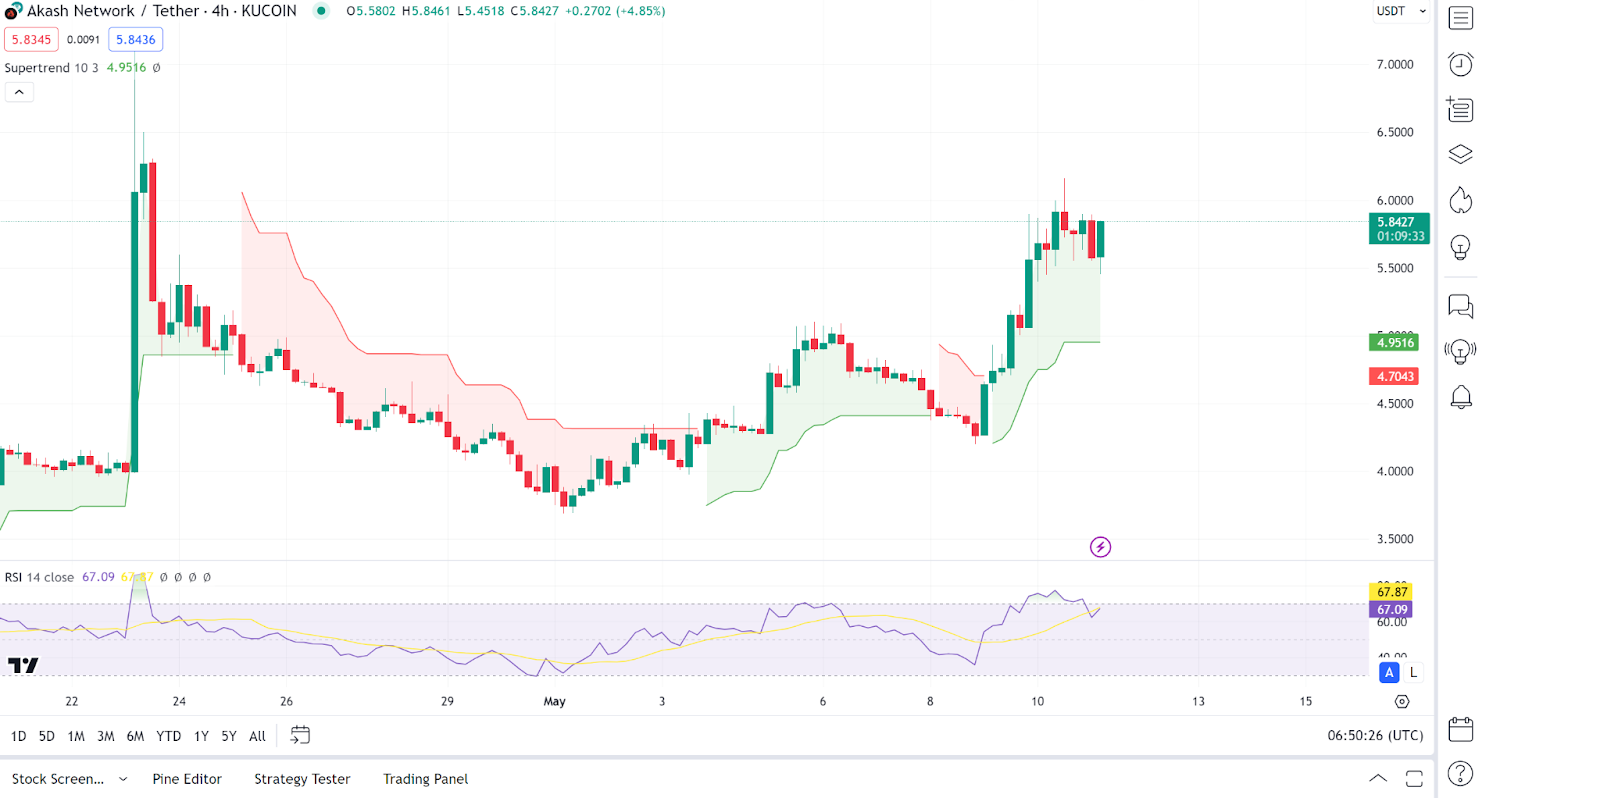
Akash Network (AKT) is a gainer in today’s session as seen from its price movements. Analysing Akash Network price charts, we see that Akash Network presents a more neutral to slightly bullish scenario. The price is oscillating around the SuperTrend indicator, which recently turned green, suggesting a potential bullish reversal. The Bollinger Bands are narrowing, indicating reduced volatility.
On the other hand, we see the Relative Strength Index (RSI) is above the midpoint at around 67, which typically signals strength. However, it’s nearing overbought territory, suggesting caution. As of press time, the Akash Network price stood at $5.99, representing a 3.46% increase from its previous 24-hour price.
Toncoin Price Review
Toncoin (TON) is also another gainer in today’s session as evidenced by its price movements. Looking at an in-depth analysis, we see that Toncoin shows a bullish trend, with the price action moving above the Ichimoku cloud, indicating bullish momentum. The recent green candles confirm buyers’ dominance.
On the other hand, the Awesome Oscillator (AO) is positive and increasing, suggesting growing bullish momentum. However, its latest series of red bars could suggest fading bull pressure. The price has successfully breached past resistance levels, potentially setting up for more upside. As of press time, the Toncoin price stood at $6.88, representing a 1.44% increase from its previous 24-hour price.

Injective Price Review
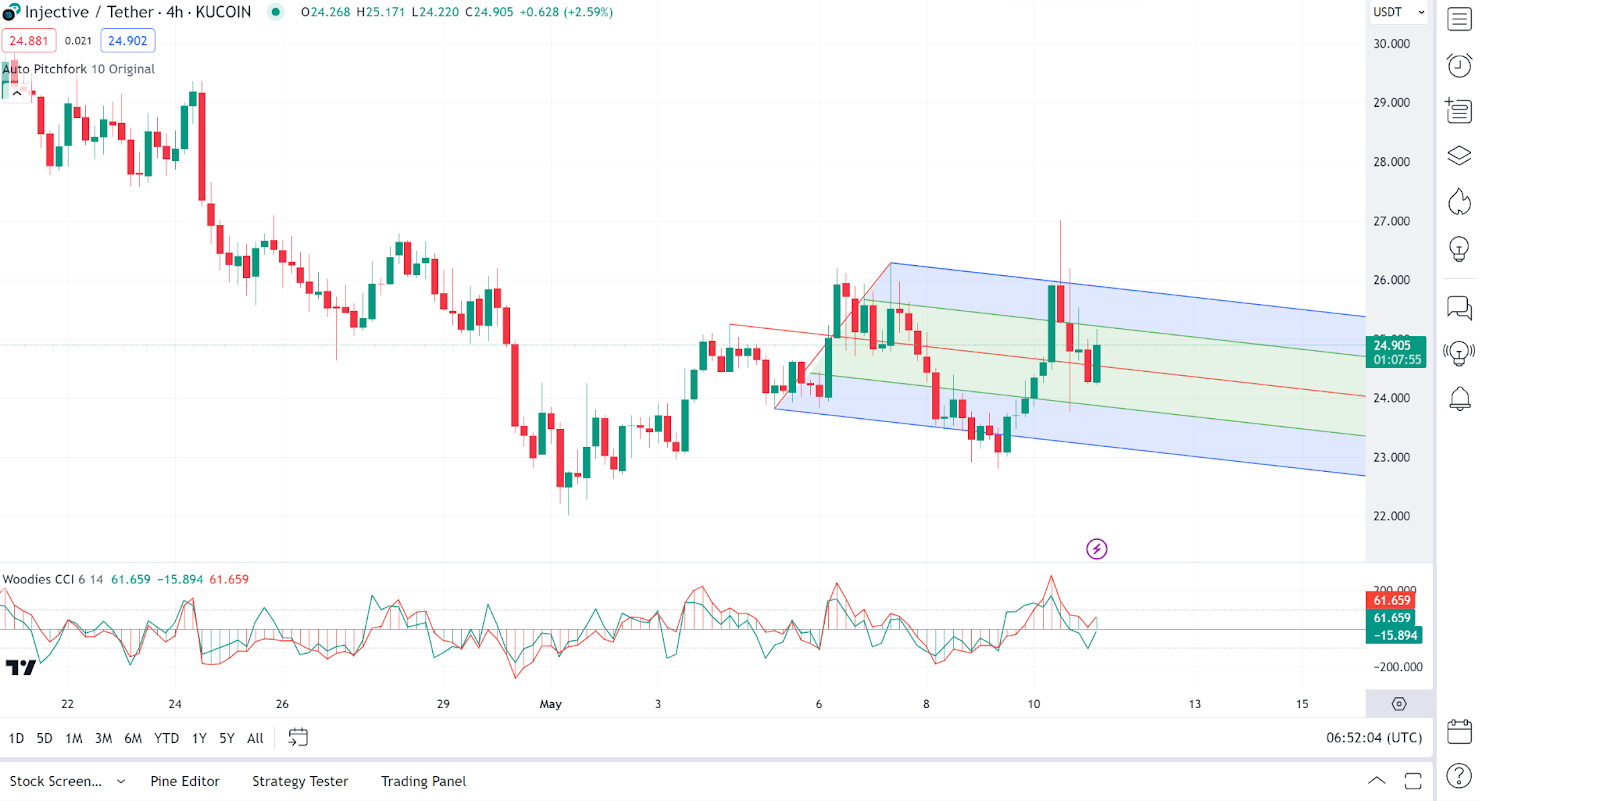
Injective (INJ) is also having a good session today as seen from its price movements. Looking at an in-depth analysis, we see that Injective Protocol’s chart reveals a fluctuating trend within a descending channel. The Auto Pitchfork tool shows the price oscillating between the median line and the lower boundary of the pitchfork, suggesting a potential for either continuation within the channel or a breakout.
On the other hand, analysing other indicators, we see that the Woodie’s CCI is close to the zero line, indicating a lack of strong momentum in either direction. As of press time, the Injective price stood at $24.78, representing a 0.89% increase from its previous 24-hour price.
24d ago•
bullish:
0
bearish:
0
Share
 Manage all your crypto, NFT and DeFi from one place
Securely connect the portfolio you’re using to start.

bullish:
0
bearish:
0


bullish:
0
bearish:
0

bullish:
0
bearish:
0