
Ethereum Price Hits Crucial Resistance Zone, Can Leverage Traders Trigger Breakout?

0
0

Key Insights:
- Ethereum price tests a major resistance zone first identified in June.
- Heavy short positions around $1,950 could shape ETH’s next move.
- Bollinger Bands squeeze points to a possible rise in market volatility.
Ethereum price is testing a resistance area that traders have watched since June. At the same time, many leveraged short positions remain around $1,950. Another chart also shows a Bollinger Bands squeeze on the daily timeframe. Together, these signals have put ETH crypto in focus as traders wait for the next price move.
Ethereum Price Reaches Resistance Zone Watched Since June
Ethereum price has moved into a resistance zone that a market analyst, MCO Global, first pointed out in June. The level is now getting fresh attention as buyers try to keep the recent recovery going.
The market analyst said the latest rise still appears to be a corrective three-wave move. That means the market has not yet shown enough strength to confirm that a new uptrend has started. In the same view, the wider bear market is still in place.

The support area between $1,600 and $1,787 remains important. Holding above that range would keep the recent recovery alive. A drop below it would weaken the current setup and shift attention to lower prices.
If that support fails, the next level to watch is around $1,400. The same chart also points the $1,100 to $1,060 area as another support zone if selling becomes stronger.
For now, traders are watching how the price reacts at the resistance. A move above it would improve market confidence, while another rejection would support the view that the recovery is only temporary. Until one of those outcomes occurs, many traders are choosing to wait rather than make aggressive trades.
ETH Crypto Short Positions at $1,950 Draw Market Attention
Another Ethereum price chart shared by market watcher CW shows that many high-leverage short positions are gathered around $1,950. That level has continued to act as resistance. Sellers have defended it, making it one of the most important prices on the chart.

The analysis says a break above $1,950 could change the picture. If buyers push through that level, traders holding short positions may have to close their trades. That buying can add more strength to an upward move.
This is why many traders are watching the same price area. It is not only a resistance level but also a place where many leveraged positions are sitting.
Still, the chart does not say a breakout will happen. It only shows why the market could react strongly if buyers finally move above that line. Until then, the resistance remains in place and traders continue to watch for confirmation.
Bollinger Bands Suggest a Bigger Move May Be Near
A separate daily chart shared by another market watcher, Cantonese Cat, points to a Bollinger Bands squeeze on ETH. This pattern appears when the Ethereum price movement gets smaller, and the bands move closer together. It often comes before a larger move, although it does not indicate the direction the market will take.
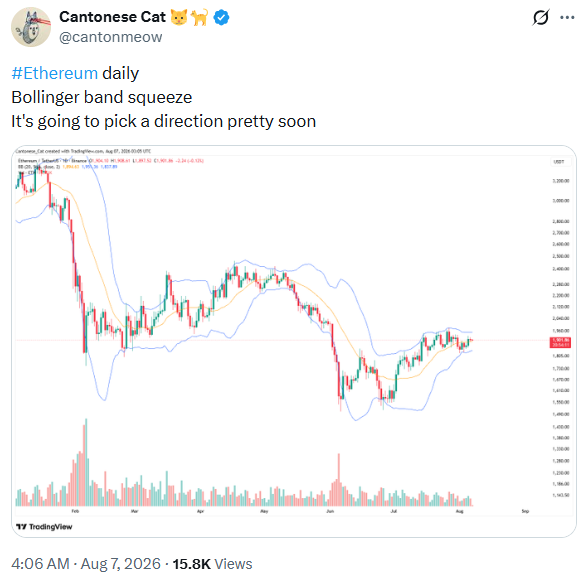
The chart simply shows that the current period of quiet trading may not last much longer. That fits with the resistance zone and the large number of short positions near $1,950.
The Ethereum price market is now sitting at an important point. Buyers want to break above resistance and continue the recovery. Sellers want the resistance to hold and keep control of the market.
The next move will decide which side gains the upper hand. Until then, traders will continue to watch the support levels, the resistance around $1,950, and the Bollinger Bands for signs of where ETH crypto may head next.
The post Ethereum Price Hits Crucial Resistance Zone, Can Leverage Traders Trigger Breakout? appeared first on The Coin Republic.
0
0

 Manage all your crypto, NFT and DeFi from one place
Securely connect the portfolio you’re using to start.

0
0

0
0

