
Dogecoin Price Prediction: Why Traders Are Watching $DOGE Closely

0
0

Dogecoin is currently trading at $0.07232 right now, down 1.2% over the last day. It's been a rough stretch; the price slid from above $0.10 back in late May and has spent the last few weeks quietly building a base near $0.072–$0.075.
This dogecoin price prediction looks at where DOGE could head next in the crypto-dogecoin market.
If buyers step back in and take control, DOGE has room to climb toward its recent swing highs.
If sellers stay in charge instead, expect another leg down toward the lower support zone. For now the coin's stuck in a tight range, waiting on a clear push in either direction.
DOGE Price Today and Market Snapshot
Dogecoin news today isn't screaming in either direction, honestly. DOGE is parked at $0.07232, having slipped 1.2% over the past day inside a tight $0.07207–$0.07345 range.
Market cap sits at $11.224 billion on a circulating supply of 155.184 billion DOGE out of a total supply of 170.896 billion.
Since Dogecoin has no max supply cap, the usual fully diluted valuation debate doesn't really apply here the way it does for capped tokens. 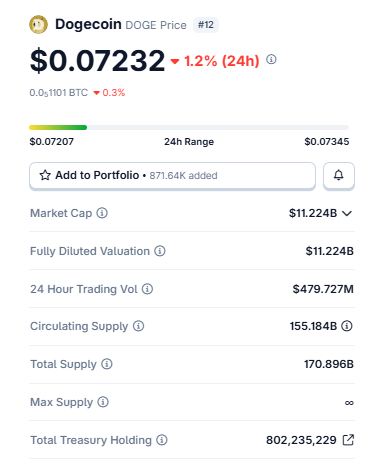
Source: Data Taken From CoinGecko, data as of July 23, 2026. Figures may vary slightly across other tracking websites.
24-hour trading volume is running at $479.727 million, and on-chain treasury holdings linked to the network sit around 802,235,229 DOGE.
Anyone holding DOGE in a dogecoin wallet right now isn't seeing much action either way, but that could change fast once the current setup resolves.
This kind of grinding, low-conviction price action is typical after a sharp June selloff. The token dropped from above $0.10 in late May down through the $0.072–$0.075 shelf, and it's basically been building a base there since.
Anyone asking if dogecoin is going up right now needs to watch two charts side by side, the 4H triangle and the 1D trendline. Both are telling a version of the same story.
Dogecoin Liquidation Heatmap
The liquidation heatmap data adds useful context to the price action.
Over the past 24 hours, $1.62 million in DOGE positions got liquidated, and the split is lopsided: $1.52 million of that was long liquidations against just $97.84K in shorts.
That flush was front-loaded in the 12-hour window too, where $813.93K of the $860.01K total wiped-out positions were long.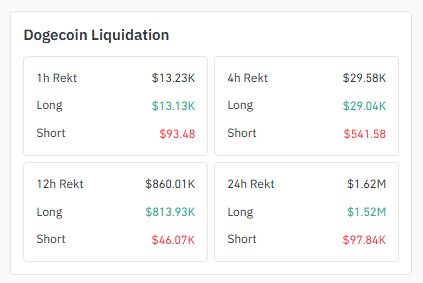
Source: According to Coinglass Liquidation Data
Classic signature of over-leveraged longs getting squeezed on the pullback from the $0.075 zone.
On the bright side for bulls, because a significant portion of weak-handed leverage has already been flushed out, the market faces reduced risk of overhead long liquidation immediately above current price levels.
The more recent 1h and 4h windows show liquidations cooling off sharply ($13.23K and $29.58K, respectively), suggesting the flush has mostly run its course for now, though that can change fast if the triangle breaks either way.
Dogecoin Exchange Volume Heatmap
Futures exchange volume for Dogecoin is heavily concentrated on two platforms.
Binance leads with $275.86 million, followed by OKX at $179.06 million. Together these two account for the bulk of DOGE derivatives activity. 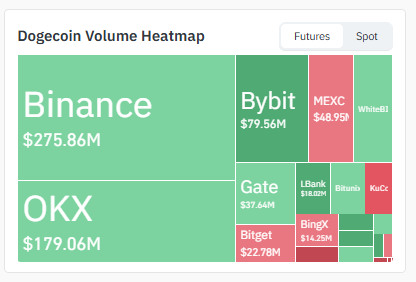
Source: According to Coinglass Volume Heatmap Data
Bybit ($79.56M), MEXC ($48.95M), Gate ($37.64M), Bitget ($22.78M), LBank ($18.02M), and BingX ($14.25M) make up the rest of the visible order flow.
This concentration matters for anyone tracking a breakout: since Binance and OKX dominate liquidity, a genuine breakout confirmation should show up as a clear volume surge on those two venues first.
If a move above $0.07543 happens without participation from Binance and OKX order books, it's more likely a thin, low-liquidity poke than a sustainable breakout.
DOGE Social Sentiment And News
On the social side, dogecoin news today includes a widely shared post from the account WhaleInsider announcing that the "Do Only Good Everyday" DOGE entity has filed as a limited liability company in Kentucky.
Worth flagging upfront: that post is tagged as a paid partnership, meaning it's sponsored content rather than independent reporting, so treat it as promotional in nature rather than confirmed, verified news. 
Source: Data Taken From @WhaleInsider, X Account.
That said, if accurate, formal legal structuring around Dogecoin-adjacent entities is the kind of incremental development that feeds into the broader Dogecoin ETF and institutional legitimacy narrative that's been circulating this year, even if it doesn't move price on its own.
There's still no confirmed Dogecoin ETF launch date on the table, but chatter around one keeps resurfacing every few weeks in DOGE news cycles, and that speculation alone tends to nudge sentiment even without any real catalyst behind it.
Broader sentiment right now looks more technical than narrative-driven; traders are watching the triangle and the trendline more than they're reacting to headlines, which lines up with the muted price action.
How DOGE Compares To Other Meme-Sector Majors
Dogecoin 4H Chart: Symmetrical Triangle Nears Apex
Zooming into the 4-hour timeframe, DOGE has been carving out a textbook symmetrical triangle since late June.
Lower highs are stacking down from the $0.07935 swing high, while higher lows are climbing up from the $0.06950 zone, and those two trendlines are converging fast.
Price is currently trading right around $0.07236, basically sitting on top of the lower boundary with the apex only a handful of candles away. 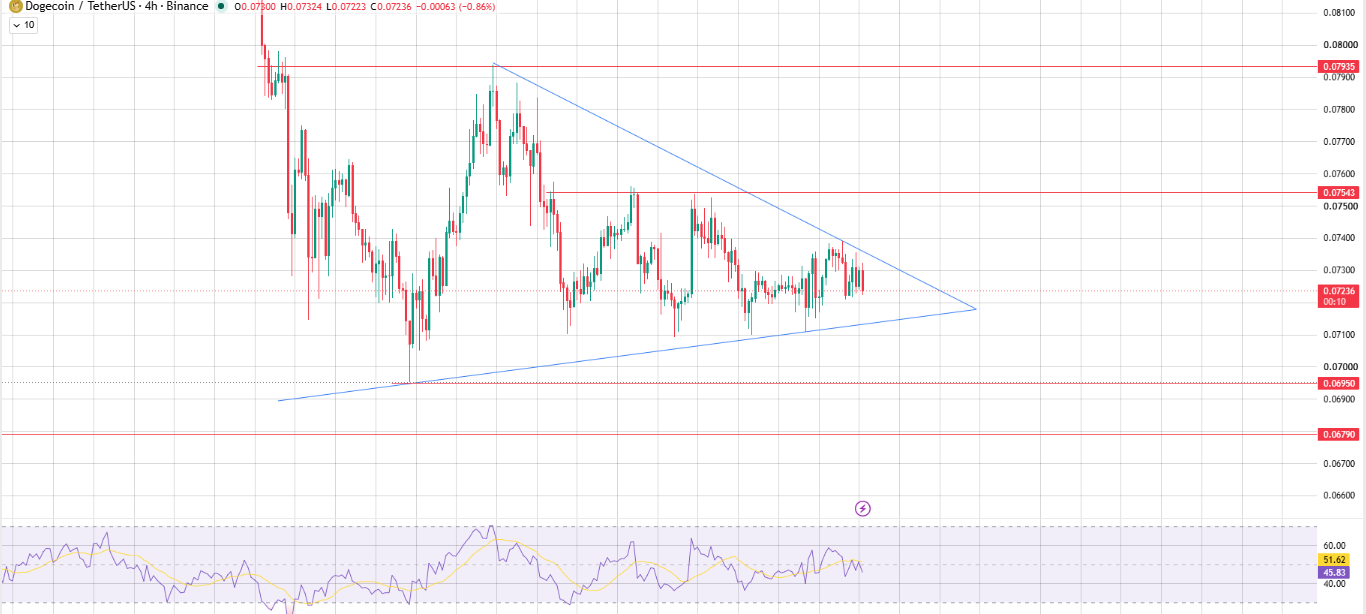
Source: Chart Taken From TradingView at 23.07.2026
If the price instead slides and starts printing lower highs on every bounce, that structure would start to resemble a descending channel rather than a clean symmetrical triangle, which would tilt the near-term bias more firmly bearish.
Inside that triangle there's a clear mid-level to watch: $0.07543. It's acted as an intraday resistance level more than once already, so it's the first hurdle before anything bigger happens.
Above it sits $0.07935, the upper edge of the triangle and the level that would confirm a genuine bullish breakout if exchange volume shows up to back it.
Below the structure, $0.06950 is the immediate floor. $0.06790 comes next if that support zone gives way.
RSI on the 4H is reading 51.62, with its moving average line at 45.83, right around the midline. About as neutral as momentum gets.
It's not confirming a breakout or a breakdown yet, just reflecting the chop of a market waiting for a catalyst.
Traders should treat any triangle breakout without a matching volume spike as suspect. Low-volume breakouts inside a squeeze like this tend to fake out and reverse.
Dogecoin 1D Chart: Trendline Support in Focus
Step back to the daily chart, and the bigger picture gets clearer.
DOGE has been riding a rising trendline support since early July, currently sitting just under the $0.0710–$0.0720 zone.
This trendline is the real tell for where price goes next. As long as dips keep getting bought along with it, the setup favors a move higher first toward $0.08249, then $0.09259, and eventually the $0.10108 price target region that capped the last leg down.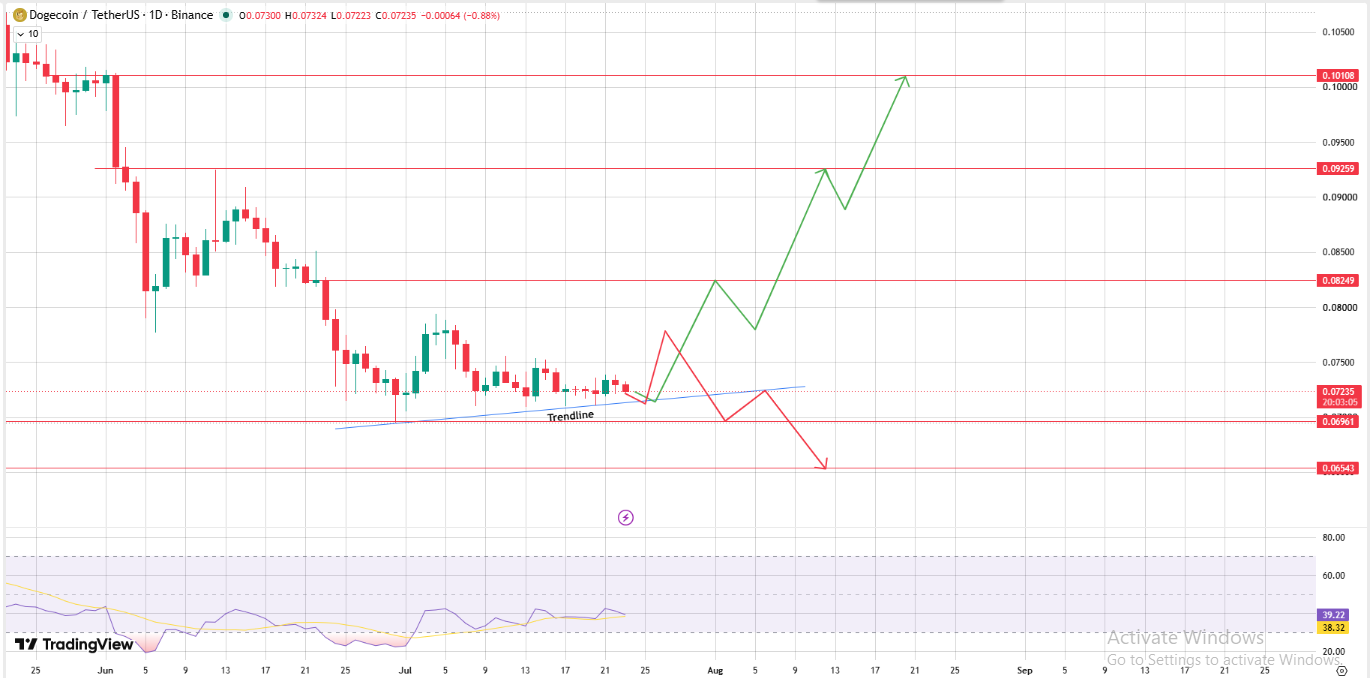
Source: Chart Taken From TradingView at 23.07.2026
If that trendline breaks instead, the daily chart points to a much less friendly path. A confirmed bearish breakdown below the line sends the price back to the $0.06961 pivot first.
If that doesn't hold, down toward the $0.06543 support zone, which lines up closely with the lower boundary of the 4H triangle.
That confluence between the daily trendline break and the 4H triangle support makes $0.0654–$0.0679 an important zone to watch as a cluster, not just one isolated number.
Daily RSI is at 39.22, with its moving average at 38.32, below the neutral 50 mark but curling upward off recent lows.
Consistent with a market that got oversold in June and is now stabilizing rather than accelerating in either direction.
It's not a buy signal on its own, but it's not a warning sign either. It's the kind of RSI print you'd expect right before a decisive move, once the triangle resolves.
DOGE Price Prediction: Bull, Base, and Bear Scenarios
This kind of three-way split matters more than a single number.
A dogecoin price prediction that ignores the base-case chop scenario is ignoring what the chart is actually doing right now. DOGE isn't trending; it's compressing, and compressions resolve sharply once they break.
Final Outlook: Is Dogecoin Going To Go Up?
Pulling it together: DOGE is sitting at a genuine decision point, not a random spot on the chart.
The 4H triangle and the 1D trendline are both nearing resolution around the same time, and the liquidation data shows over-leveraged longs have already been cleared out to some degree.
That reduces one source of downside pressure, but it doesn't guarantee direction.
Dogecoin's price action also doesn't move in isolation; broader BTC dominance trends, along with ETH correlation across the majors, tend to set the tone for how much room alt-majors like DOGE actually have to run on any given breakout.
If Bitcoin holds its own range steady, DOGE's triangle breakout is more likely to play out cleanly in either direction based on its own structure.
If BTC gets volatile, expect DOGE's triangle to resolve faster and messier than the clean lines on the chart suggest.
For now, the levels that matter are $0.07543 and $0.07935 on the upside, and $0.06950 and $0.06790 on the downside, with the 1D trendline near $0.0710–$0.0720 as the master signal.
Whether the dogecoin bull run trends resume from here comes down to which side of that triangle gets broken with real volume behind it, not to whether DOGE will hit $1 anytime soon.
Which remains a much longer-horizon question tied to total supply and market cap math rather than short-term chart patterns.
Quick Glossary
A few terms that show up a lot in this piece, in case some of these are new to you.
A symmetrical triangle is basically a squeeze: price makes lower highs on one side and higher lows on the other, and both lines meet at a point. It usually doesn't stay quiet for long once it gets there.
Trendline support is just a rising line drawn under a series of higher lows, and traders watch it to see if buyers are still showing up on dips.
A liquidation heatmap shows where leveraged positions are sitting close to getting force-closed, so it's a rough map of pain points on the chart.
And RSI, or Relative Strength Index, is a 0–100 momentum gauge; above 70 usually means overbought, below 30 usually means oversold, and anywhere near 50 just means the market can't make up its mind.
A Quick Note On How This Was Put Together
Every level in this article, whether it's the triangle boundaries or the trendline zones, came straight off the 1D and 4H TradingView charts reviewed while writing this; nothing here was extrapolated or guessed at.
The liquidation and exchange volume numbers are pulled from Coinglass-style data.
Price, market cap, and supply figures are a snapshot from July 23, 2026, so by the time you're reading this, some of these numbers may have already moved. Worth checking a live chart before acting on anything here.
Disclaimer: This article is for informational purposes only and is not financial advice. Cryptocurrency markets are volatile; do your own research before investing.
0
0

 Manage all your crypto, NFT and DeFi from one place
Securely connect the portfolio you’re using to start.

0
0


0
0
