Stellar (XLM) Risks Falling to 13-Month Low Amid Bearish Activity Spike
5h ago•

bullish:
0
bearish:
0
Share

The value of XLM, the token that powers the peer-to-peer (P2P) decentralized network Stellar, is at risk of falling to its lowest since June 2023.
Although the token’s price has surged by 13% in the past month amid the general market rally, increased profit-taking activity may cause it to shed these gains.
Stellar Sellers Begin to Dominate Market
As of this writing, XLM trades at $0.10. Impacted by last month’s broader market rally and an uptick in demand for the asset, XLM’s value has risen by double digits in the past 30 days.
However, according to some of the token’s key technical indicators, as profit-taking intensifies, market sentiment is shifting from bullish to bearish.
Readings from XLM’s Moving Average Convergence Divergence (MACD) indicator point to this. At press time, the token’s MACD line (blue) is poised to cross below the signal line (orange).
This indicator tracks an asset’s momentum and trend direction by analyzing its price movements. When the MACD line attempts to cross below the signal line, it is a bearish signal. It suggests that the asset’s recent momentum is weakening. Traders interpret this as a potential signal to sell, as it often precedes a price decline.
Another indicator of XLM’s looming price decline is its falling Chaikin Money Flow (CMF). Although the indicator still rests above the zero line, its downtrend suggests that market participants are beginning to remove liquidity from the market.
At press time, XLM’s CMF is 0.17. If an asset’s CMF is positive but declining, it suggests that while there is still more buying than selling, the buying pressure is weakening.
Read More: How To Buy Stellar (XLM) and Everything You Need To Know
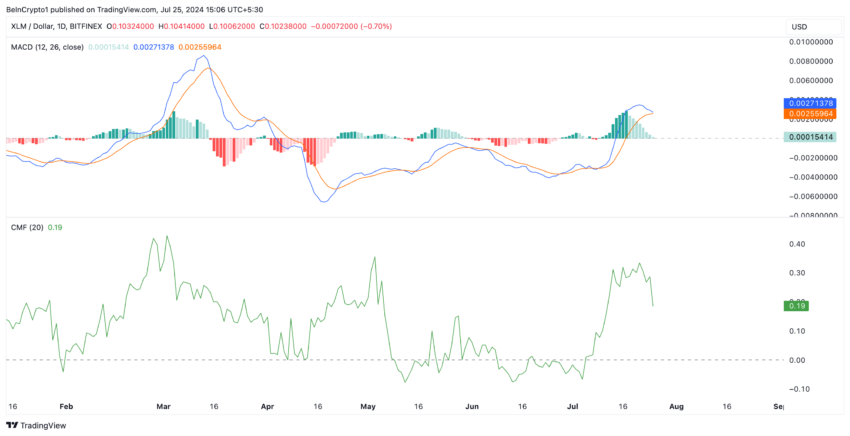 Stellar Analysis. Source: TradingView
Confirming the decline in buying pressure, XLM currently trades at its 20-day exponential moving average (EMA), which tracks an asset’s average price over the past 20 trading days.
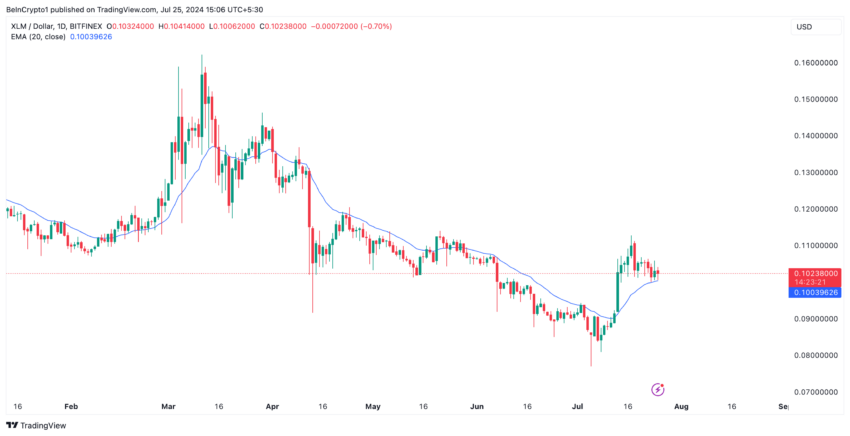 Stellar Analysis. Source: TradingView
When an asset is trading at its 20-day EMA and shows signs of potentially falling below it, it suggests that the buying momentum is weakening. It signals that sellers could be gaining control, which might lead to a further price decline.
XLM Price Prediction: A Fall To a Yearly Low Is Imminent
If this trend persists and selling pressure outweighs token accumulation, XLM’s price may fall to $0.077. The last time the altcoin traded at this low was in June 2023.
Read More: Stellar (XLM) Price Prediction 2024/2025/2030
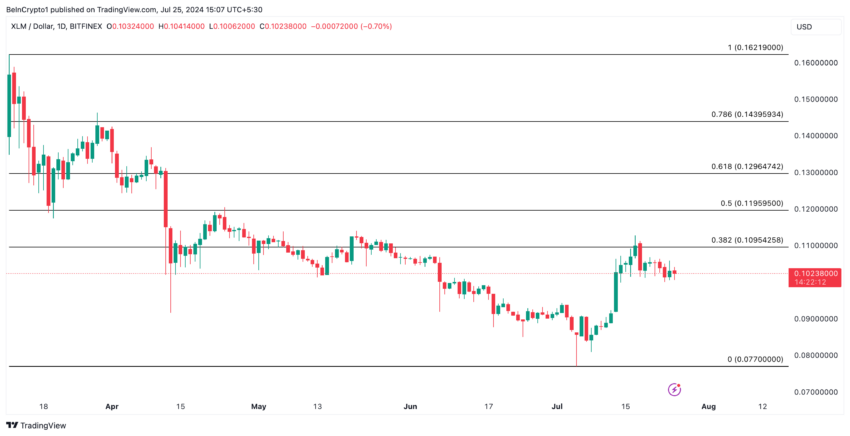 Stellar Analysis. Source: TradingView
However, if the market trend shifts from bearish to bullish, XLM would gain, and it might exchange hands at $0.11.
5h ago•
bullish:
0
bearish:
0
Share


 Manage all your crypto, NFT and DeFi from one place
Securely connect the portfolio you’re using to start.

bullish:
0
bearish:
0

bullish:
0
bearish:
0

bullish:
0
bearish:
0

bullish:
0
bearish:
0